
ECB-IMG-208687
Echinobase Image ID: 208687
|
|
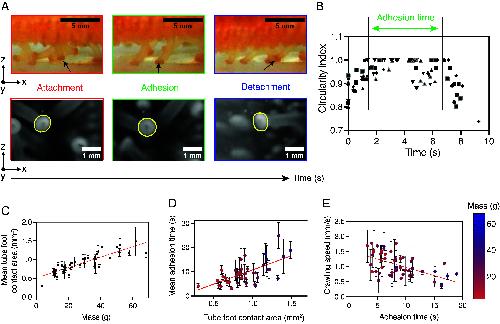
Fig. 4. Tube foot adhesion time correlates with sea star locomotion in A. rubens. (A) High-magnification imaging reveals the three stages of tube foot adhesion during locomotion. Top panels show side views of an individual in motion, while Bottom panels display views of the ambulacral groove. Adhesion time is defined as the duration of the adhesion stage. (B) Temporal variation in the circularity index of individual tube feet (n = 10). Vertical lines indicate the start and end of the adhesion phase. (C) Relationship between mean tube foot contact area and body mass (n = 39, R2 = 0.6203, P < 0.0001). In log–log space, the slope is 0.42 (95 % CI 0.38 to 0.47), showing that contact area increases more slowly than predicted by isometry, consistent with negative allometry. (D) Relationship between mean adhesion time and tube foot contact area (n = 39, R2 = 0.3088, P < 0.0001). (E) Crawling speed as a function of tube foot adhesion time (n = 49, R2 = 0.2115, P < 0.0001). All data are presented as mean ± SD. Image published in: Deridoux A et al. (2026) Image downloaded from an Open Access article in PubMed Central. Copyright © 2026 the Author(s). Published by PNAS. Larger Image Printer Friendly View |