
ECB-IMG-208682
Echinobase Image ID: 208682
|
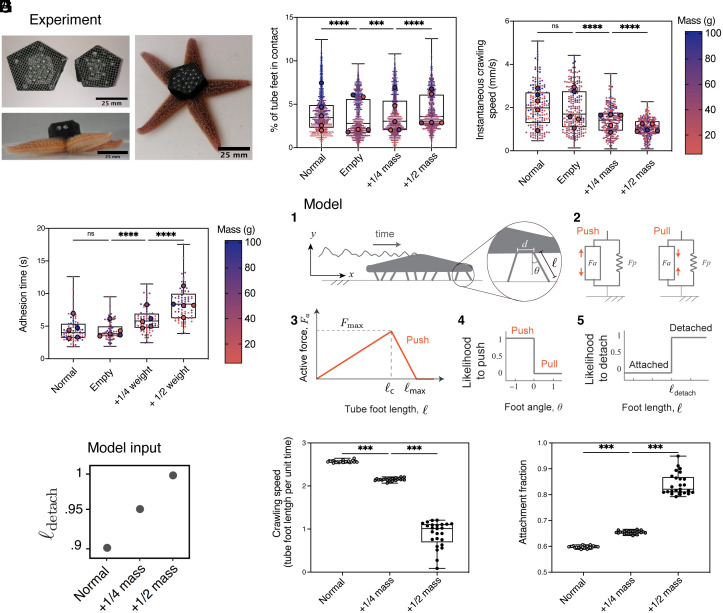
Fig. 5. Sea star locomotion dynamics in response to load changes are modulated by adhesion time in A. rubens. (A) Photographs showing two representative sizes of 3D-printed backpacks used to artificially increase the body mass by 25 and 50% with stainless steel beads. (B) Percentage of tube feet in contact with the substrate, (C) instantaneous crawling speed, and (D) tube foot adhesion time under four conditions: normal locomotion, empty backpack, +25% body mass, and +50% body mass (N = 5 sea stars per condition). Data in all superplots are color-coded by mass. Each small dot corresponds to a single tube foot contact event, and large dots indicate means per individual. Three replicates were performed per sea star. (E) Schematic of the biomechanical model used to simulate sea star locomotion through locally controlled tube feet. (1) Model organism propelled by 10 tube feet. The inset defines key parameters: tube foot length (l), tilt angle (θ), and interfoot spacing (d). (2) Mechanical model of a single tube foot, composed of a passive linear spring and an active force generator capable of producing either pushing or pulling forces depending on muscle activation. (3) Active force profile based on Hill’s muscle model. (4) Local control policies at the level of individual tube feet. These define the probability of transitions between pushing and pulling states and between attached and detached states, based on sensory feedback. (5) Tube feet detach when stretched beyond a threshold length ldetach. (F) The corresponding length of detachment for the tube feet are ldetach = 0.9, 0.95, 1, respectively. Parameter values are N =100, L = 40, l = 1, Fmax = 0.4, λ = 5 (G) Simulated crawling speed and (H) attachment fraction τ, with τ=∑i=1NTiattached/NT, defined as the sum over all tube feet of the time Tiattached each foot spends in attachment, divided by the total simulation time T times the number N of tube feet. Both metrics are shown as a function of sea star mass, increasing from baseline to highest (W = 2, 2.5, 3). For each mass condition, 25 simulations were performed with randomized initial foot states. ***P < 0.001, ****P < 0.0001, and ns = not significant. Image published in: Deridoux A et al. (2026) Image downloaded from an Open Access article in PubMed Central. Copyright © 2026 the Author(s). Published by PNAS. Larger Image Printer Friendly View |