
ECB-IMG-208679
Echinobase Image ID: 208679
|
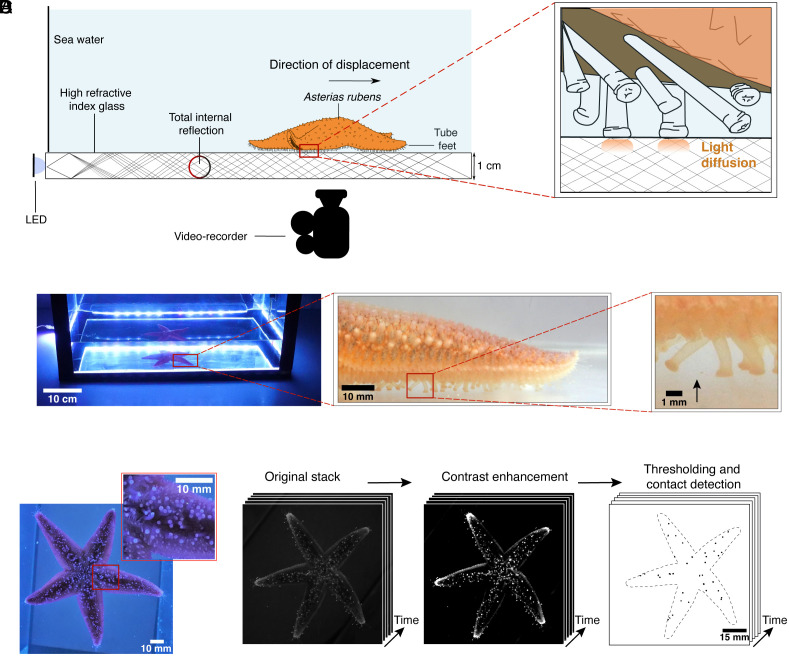
Fig. 2. Quantification of tube feet dynamics using FTIR-based imaging. (A) Schematic representation of the experimental setup, which adapts the principle of FTIR to a custom-designed aquarium. When tube feet make contact with the FTIR-equipped glass surface, they disrupt the total internal reflection, causing light to scatter and locally illuminate the contact area. Sea stars are allowed to move freely, and their movements are recorded from below using a camera positioned beneath the tank. (B) Photograph of the experimental setup showing the aquarium equipped with an FTIR-based imaging system. The inset provides a close-up view of an A. rubens arm, where contact points of individual tube feet with the substrate are clearly visible during locomotion (arrow). (C) Image of the oral surface of A. rubens crawling within the experimental setup. (D) Image analysis pipeline developed to quantify the number of adhering tube feet and their contact area over time from image sequences. The method includes contrast enhancement, thresholding, and automated detection for accurate temporal tracking. Image published in: Deridoux A et al. (2026) Image downloaded from an Open Access article in PubMed Central. Copyright © 2026 the Author(s). Published by PNAS. Larger Image Printer Friendly View |