
ECB-IMG-208678
Echinobase Image ID: 208678
|
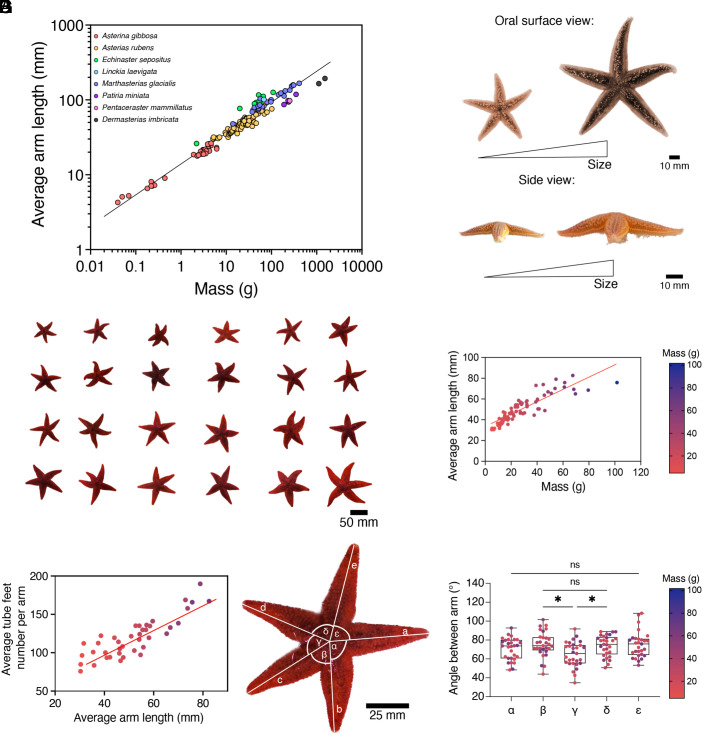
Fig. 1. Allometric scaling in sea stars. (A) Relationship between the average arm length and the sea star mass across 8 species with five arms: Asterina gibbosa (red, n = 37), Echinaster sepositus (green, n = 14), Asterias rubens (orange, n = 74), Marthasterias glacialis (blue, n = 23), Linckia laevigata (light blue, n = 2), Patiria miniata (purple, n = 4), Dermasterias imbricata (black, n = 2), and Pentaceraster mammillatus (pink, n = 1). Each dot represents one individual (n = 157 sea stars, R2 = 0.9541, P < 0.0001). The estimated slope is 0.41 (95 % CI 0.40 to 0.43), indicating positive allometry between arm length and body mass. (B) Oral and lateral views of two individuals of A. rubens illustrating size variability. (C) Range of sizes observed in A. rubens. (Scale bar, 50 mm.) (D) Relationship between the body mass and the average arm length (n = 74, R2 = 0.7629, P < 0.0001). (E) Relationship between the average tube feet number per arm and the average arm length of A. rubens individuals (n = 40, R2 = 0.7056, P < 0.0001). (F) Aboral view of A. rubens showing labeled arms and the corresponding interarm angles. (Scale bar, 25 mm.) (G) Measurements of interarm angle (n = 29). All data are color-coded by individual mass with *P < 0.05 and ns is not significant. Image published in: Deridoux A et al. (2026) Image downloaded from an Open Access article in PubMed Central. Copyright © 2026 the Author(s). Published by PNAS. Larger Image Printer Friendly View |