
ECB-IMG-208670
Echinobase Image ID: 208670
|
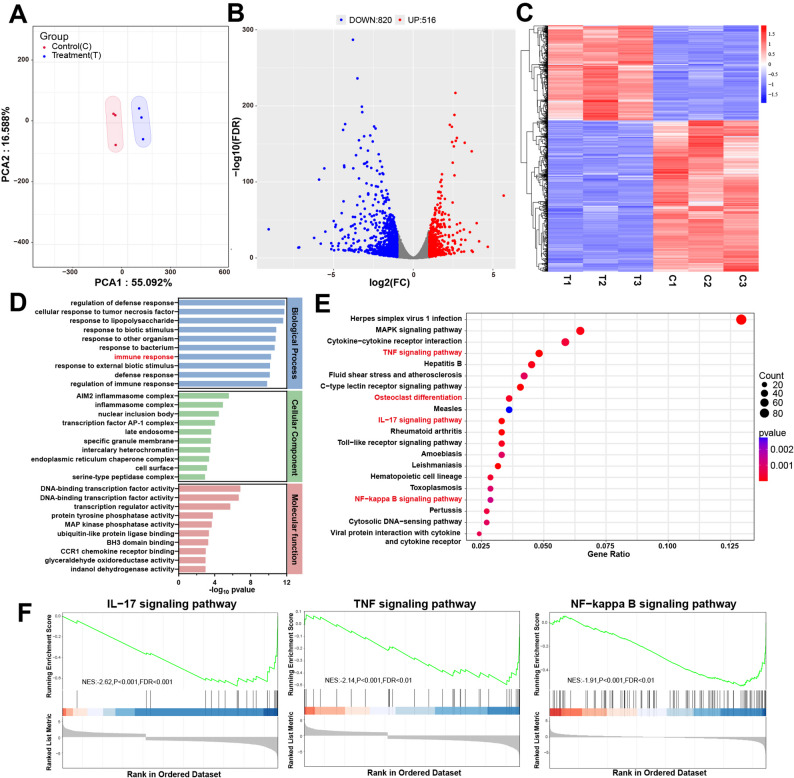
Fig. 5. The anti-inflammation mechanism of BA@PDA-PA. (A) PCA results of RAW264.7 cells sequencing in two groups. (B) Volcano plot displaying up-regulated and down-regulated genes in RAW264.7 cells. (C) Related heatmap. (D) GO analysis. (E) KEGG pathway enrichment analysis. (F) GSEA results Image published in: Shen X et al. (2026) Image downloaded from an Open Access article in PubMed Central. © The Author(s) 2026 Larger Image Printer Friendly View |