
ECB-IMG-208669
Echinobase Image ID: 208669
|
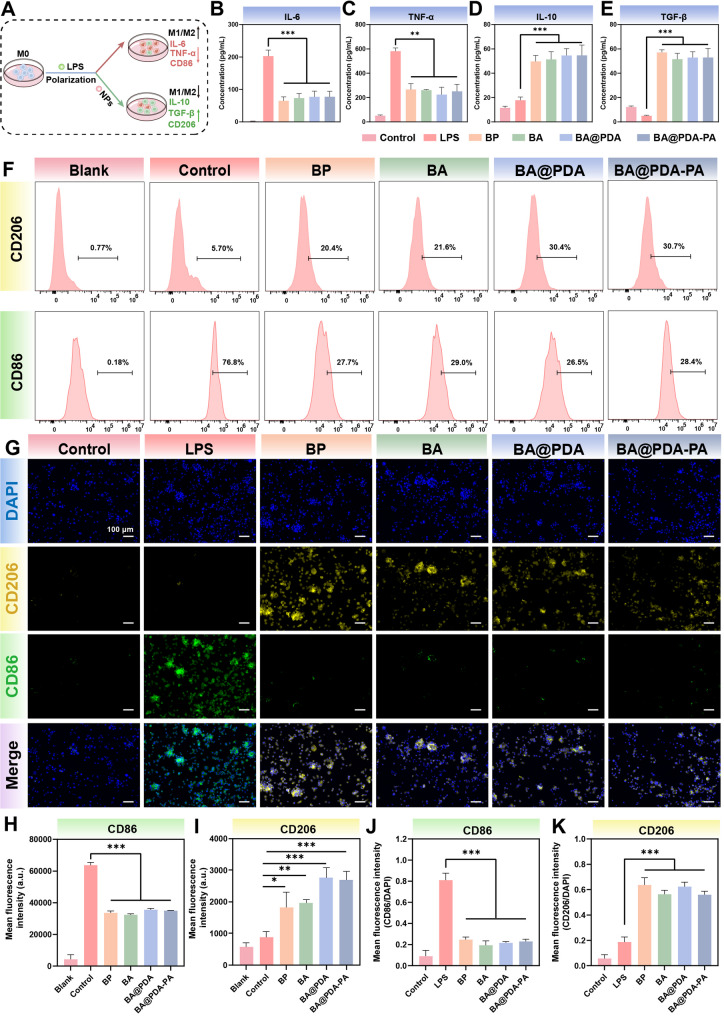
Fig. 4. Immunomodulatory effects of BP, BA, BA@PDA and BA@PDA-PA. (A) The scheme of inflammation regulation of nanoparticles. (B-E) ELISA assays of IL-6, TNF-α, IL-10 and TGF-β in LPS-induced RAW264.7 cells after different treatments. (F) Flow cytometry analysis of the expression of CD206 and CD86 in RAW264.7 cells with different treatments. (G) Immunofluorescence images of CD206 and CD86 in RAW264.7 cells with different treatments. (H) Quantitative analysis of the fluorescence intensity of CD86 in flow cytometry. (I) Quantitative analysis of the fluorescence intensity of CD206 in flow cytometry. (J) Quantitative analysis of CD86 in immunofluorescence images. (K) Quantitative analysis of CD206 in immunofluorescence images. Data are means ± S.D. (n ≥ 3), *p < 0.05, **p < 0.01, ***p < 0.001 Image published in: Shen X et al. (2026) Image downloaded from an Open Access article in PubMed Central. © The Author(s) 2026 Larger Image Printer Friendly View |