
ECB-IMG-208667
Echinobase Image ID: 208667
|
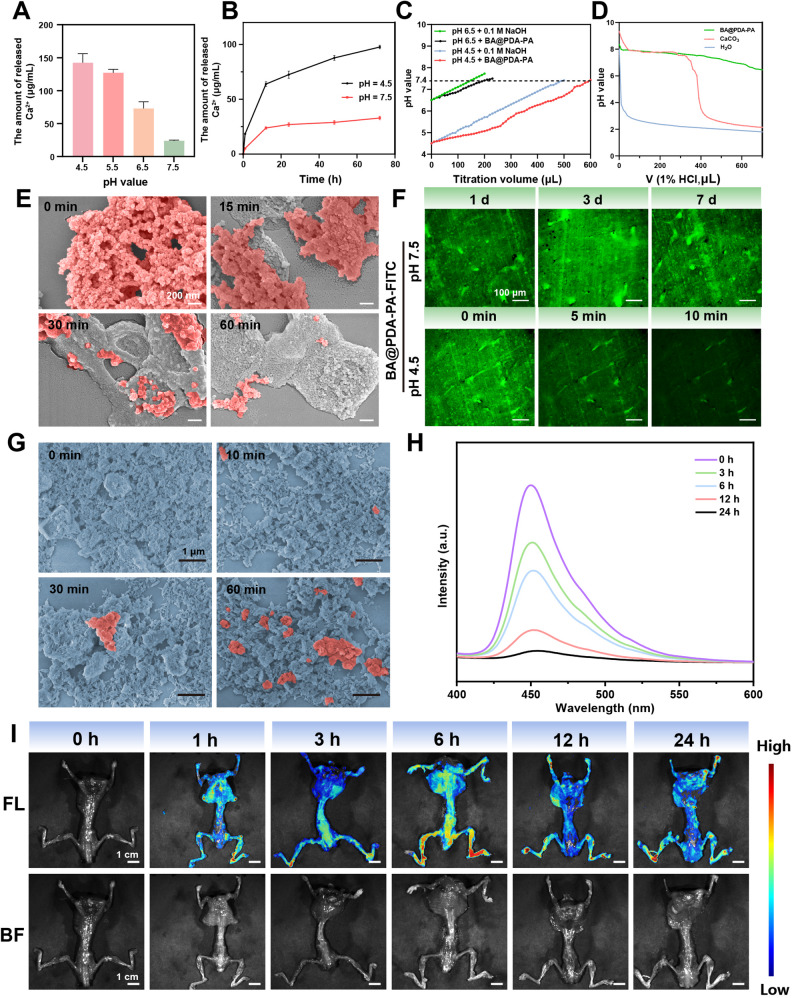
Fig. 2. The acid-responsiveness and targeting performance of BA@PDA-PA. (A) The total amount of Ca2+ released by BA@PDA-PA in PBS with various pH values. (B) Ca2+ release from BA@PDA-PA at different pH (7.5 and 4.5) for 72 h. (C) Acidity neutralization by BA@PDA-PA. (D) pH value changes during the HCl (1%, v/v) titration to BA@PDA-PA, deionized water, and CaCO3. (E) The SEM images of BA@PDA-PA at the mild acidic (pH 4.5) condition for 0–60 min. (F) Fluorescence microscopic analysis regarding BA@PDA-PA distribution on bone surface at different pH values. (G) Representative SEM images of the interaction between the surface of BA@PDA-PA and HAP at various time points. (H) Fluorescence intensity of the supernatant of BA@PDA-PA after stirring in HAP solution for different time points. (I) In vivo fluorescence images at diverse times post-injection of BA@PDA-PA in mice. FL: Fluorescence imaging mode; BF: Bright field imaging mode. Data are means ± S.D. (n ≥ 3) Image published in: Shen X et al. (2026) Image downloaded from an Open Access article in PubMed Central. © The Author(s) 2026 Larger Image Printer Friendly View |