
ECB-IMG-208658
Echinobase Image ID: 208658
|
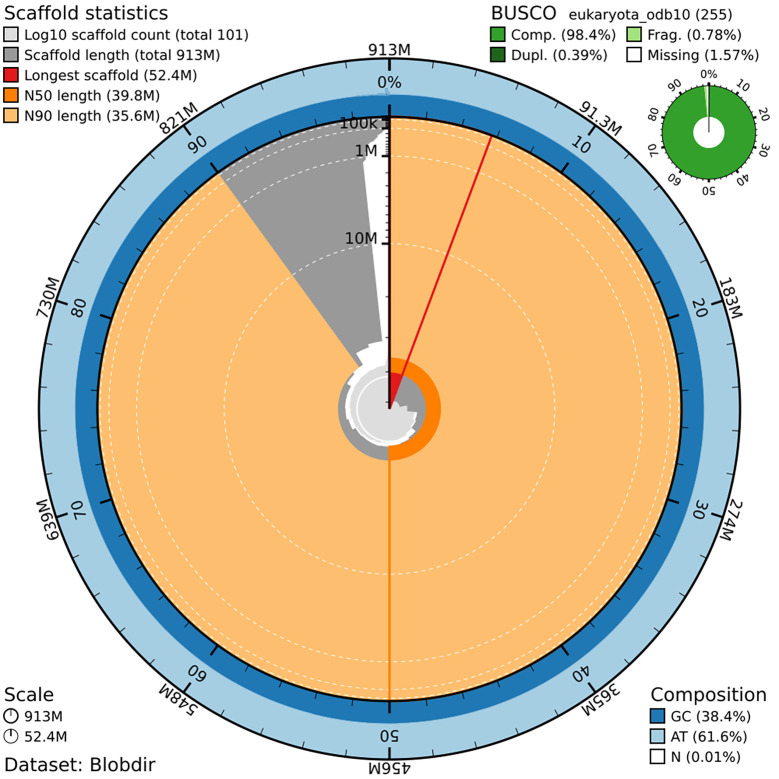
Figure 1. . Snail plot summary of assembly statistics.The main plot is divided into 1,000 size-ordered bins around the circumference, with each bin representing 0.1% of the 912,728,646 bp assembly, including the mitochondrial genome. The distribution of sequence lengths is shown in dark grey, with the plot radius scaled to the longest sequence present in the assembly (52.4 Mb, shown in red). Orange and pale-orange arcs show the scaffold N50 and N90 sequence lengths (39.8 Mb and 35.6 Mb), respectively. The pale grey spiral shows the cumulative sequence count on a log-scale, with white scale lines showing successive orders of magnitude. The blue and pale-blue area around the outside of the plot shows the distribution of GC, AT, and N percentages in the same bins as the inner plot. A summary of complete, fragmented, duplicated, and missing BUSCO genes found in the assembled genome from the Eukaryota database (odb10) is shown on the top right. Image published in: Vasileiadou K et al. (2026) Image downloaded from an Open Access article in PubMed Central. Copyright: © 2026 Vasileiadou K et al. Larger Image Printer Friendly View |