
ECB-IMG-208629
Echinobase Image ID: 208629
|
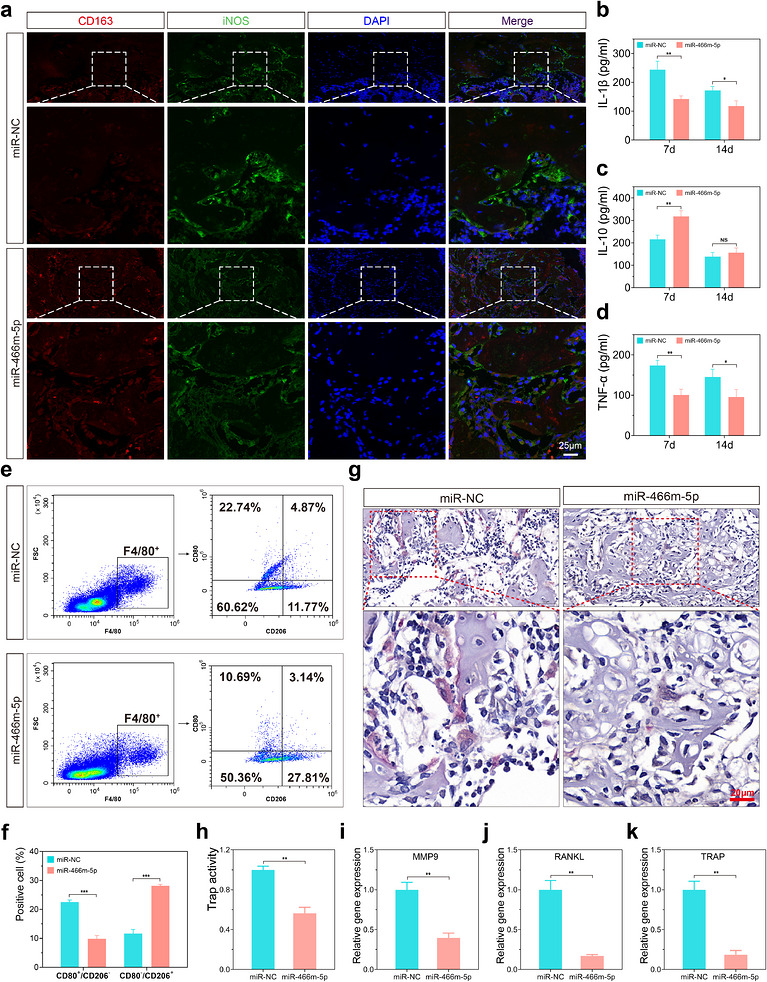
FIGURE 11. In vivo effects of miR‐466m‐5p. (a) Immunofluorescence staining of iNOS and CD163 in peri‐defect tissues 2 weeks after local injection of miR‐466m‐5p mimics or miR‐NC. ELISA quantification of inflammation‐related cytokines IL‐1β (b), IL‐10 (c), and TNF‐α (d) in the defect region. (e) Flow cytometric analysis of macrophage surface markers CD80 and CD206 in tissue‐derived cells. (f) Quantitative analysis of flow cytometry data. (g) TRAP staining of tissue sections from the miR‐466m‐5p and miR‐NC groups. (h) Quantitative assessment of TRAP activity in tissues from the miR‐466m‐5p and miR‐NC groups. (i–k) qPCR analysis of osteoclast‐related genes MMP9 (i), RANKL (j), and TRAP (k) in the respective groups. Image published in: Lu Y et al. (2026) Image downloaded from an Open Access article in PubMed Central. © 2026 The Author(s). Endocrinology, Diabetes & Metabolism published by John Wiley & Sons Ltd. Larger Image Printer Friendly View |