
ECB-IMG-208628
Echinobase Image ID: 208628
|
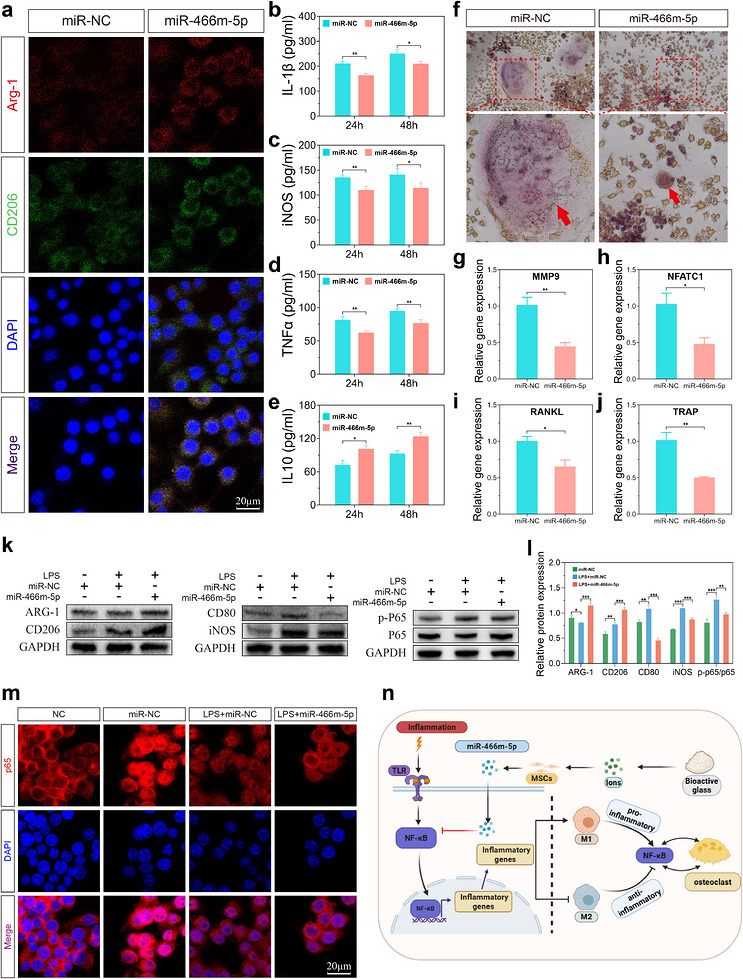
FIGURE 10. miR‐466m‐5p–mediated regulation of the immune signaling axis. (a) Immunofluorescence staining of ARG‐1 and CD206 in RAW264.7 macrophages polarized with LPS and subsequently transfected with miR‐466m‐5p mimics or miR‐NC. (b–e) ELISA quantification of inflammatory mediators IL‐1β (b), iNOS (c), TNF‐α (d), and IL‐10 (e) in LPS‐stimulated RAW264.7 cells following transfection with miR‐466m‐5p or miR‐NC. (f) TRAP staining of RAW264.7 cells after 5 days of RANKL‐induced osteoclastogenic differentiation. (g–j) qPCR analysis of osteoclast‐related genes MMP9 (g), NFATC1 (h), RANKL (i), and TRAP (j). (k) Western blot analysis of ARG‐1, CD206, CD80, iNOS, p‐P65, and total P65 expression. (l) densitometric quantification of Western blot bands. (m) immunofluorescence imaging of P65 nuclear translocation in LPS‐stimulated RAW264.7 cells with or without miR‐466m‐5p overexpression. (n) schematic illustration of the miR‐466m‐5p–mediated immune signaling axis. Image published in: Lu Y et al. (2026) Image downloaded from an Open Access article in PubMed Central. © 2026 The Author(s). Endocrinology, Diabetes & Metabolism published by John Wiley & Sons Ltd. Larger Image Printer Friendly View |