
ECB-IMG-208626
Echinobase Image ID: 208626
|
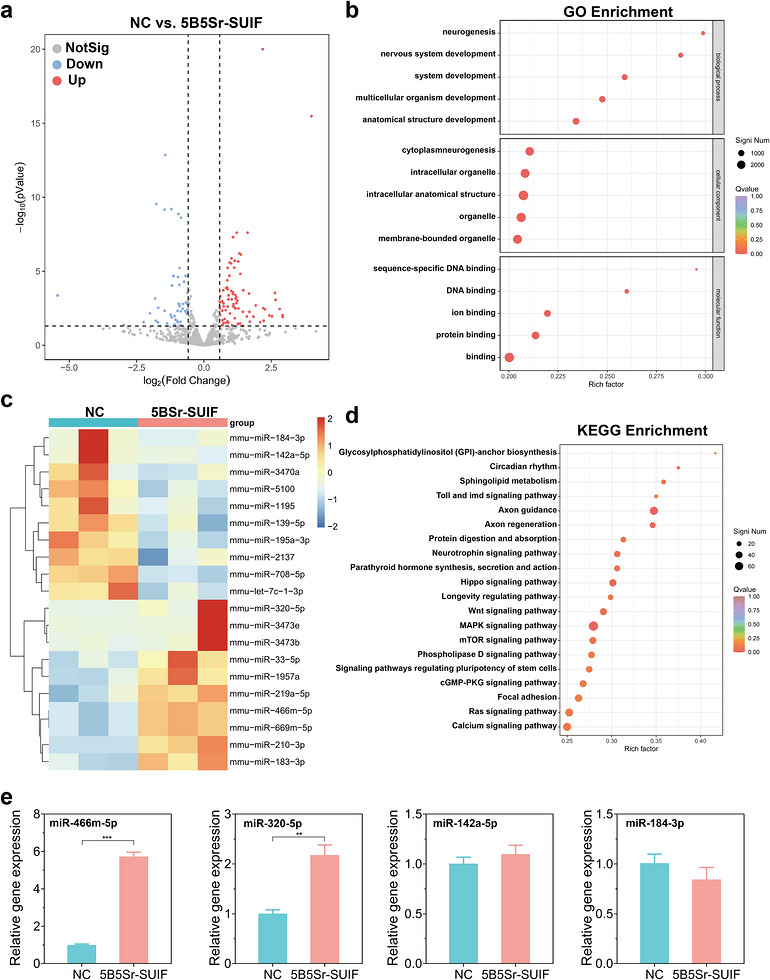
FIGURE 8. miRNA sequencing analysis of the NC and 5B5Sr‐SUIF groups. (a) Volcano plot of differentially expressed miRNAs, where red dots represent significantly upregulated miRNAs, blue dots represent significantly downregulated miRNAs, and grey dots indicate non‐significantly altered miRNAs. (b) GO enrichment analysis of differentially expressed miRNAs, with the y‐axis indicating GO term categories. (c) Hierarchical clustering heatmap of differentially expressed miRNAs. (d) KEGG bubble plot showing the top 20 enriched signaling pathways. (e) qPCR validation of miR‐466m‐5p, miR‐320‐5p, miR‐142a‐5p, and miR‐184‐3p expression levels. Image published in: Lu Y et al. (2026) Image downloaded from an Open Access article in PubMed Central. © 2026 The Author(s). Endocrinology, Diabetes & Metabolism published by John Wiley & Sons Ltd. Larger Image Printer Friendly View |