
ECB-IMG-208621
Echinobase Image ID: 208621
|
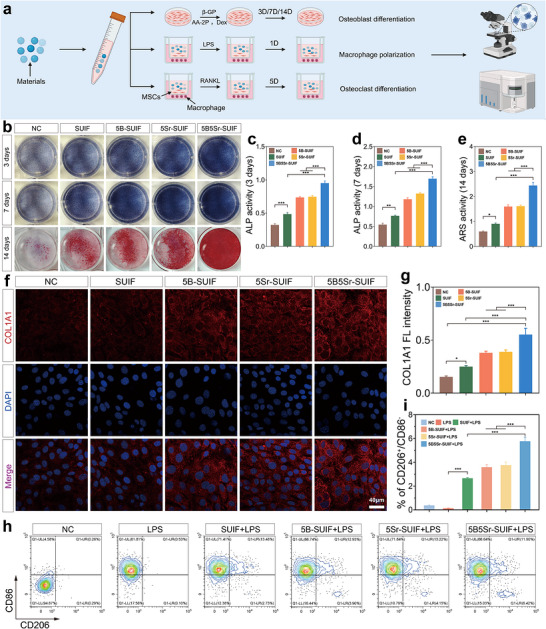
FIGURE 3. Material‐mediated osteogenic differentiation of MSCs. (a) Schematic illustration of the MSC culture and induction setup. (b) ALP staining of MSCs after 3 and 7 days of osteogenic induction and Alizarin Red S staining after 14 days. (c) Quantitative analysis of ALP activity in MSCs after 3 days of osteogenic induction. (d) Quantitative analysis of ALP activity in MSCs after 7 days of osteogenic induction. (e) semi‐quantitative analysis of Alizarin Red S staining following osteogenic induction. (f) immunofluorescence staining of COL1A1 in MSCs. (g) Quantitative analysis of COL1A1 fluorescence intensity after 3 days of osteogenic induction. (h) Flow cytometric analysis of CD80 and CD86 expression in macrophages following treatment with the material in the MSC–macrophage co‐culture system. (i) Quantitative analysis of the flow cytometry results. Image published in: Lu Y et al. (2026) Image downloaded from an Open Access article in PubMed Central. © 2026 The Author(s). Endocrinology, Diabetes & Metabolism published by John Wiley & Sons Ltd. Larger Image Printer Friendly View |