
ECB-IMG-208620
Echinobase Image ID: 208620
|
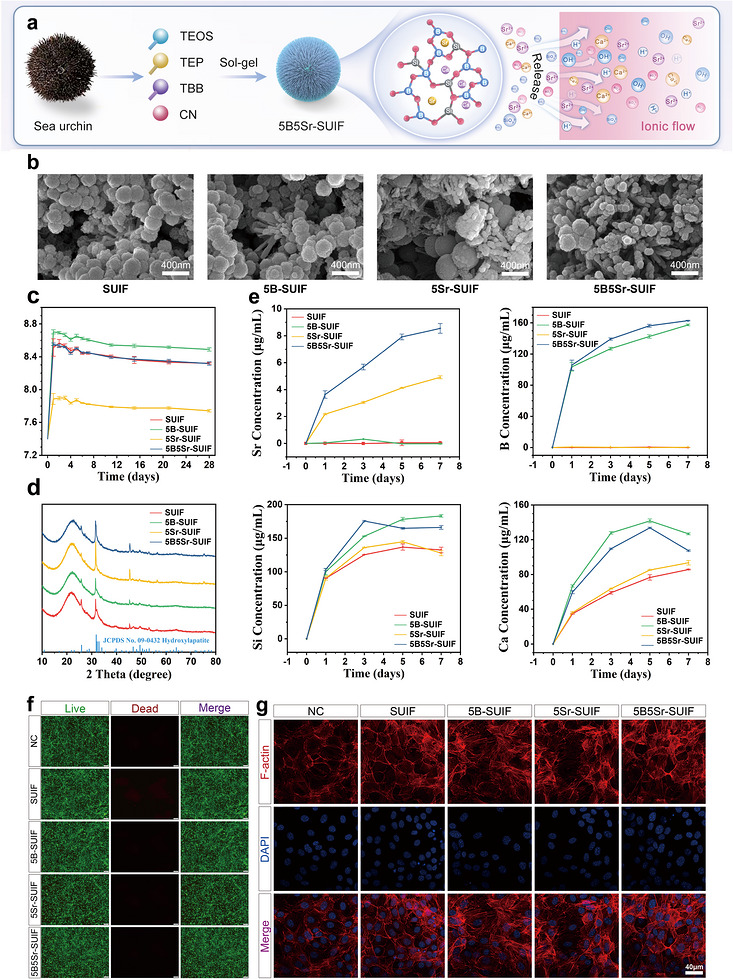
FIGURE 2. Construction of a dynamic alkaline ionic‐flux microenvironment. (a) Schematic illustration of material degradation–mediated ion release. (b) SEM images of SUIF, 5B‐SUIF, 5Sr‐SUIF, and 5B5Sr‐SUIF following immersion in PBS. (c) Time‐ dependent pH evolution of SUIF, 5B‐SUIF, 5Sr‐SUIF, and 5B5Sr‐SUIF immersed in PBS (n = 3). (d) XRD patterns of SUIF, 5B‐SUIF, 5Sr‐SUIF, and 5B5Sr‐SUIF after immersion in PBS. (e) Ion‐release profiles of SUIF, 5B‐SUIF, 5Sr‐SUIF, and 5B5Sr‐SUIF in PBS, quantified by ICP‐OES. (f) Live/dead staining of MSCs after exposure to SUIF, 5B‐SUIF, 5Sr‐SUIF, and 5B5Sr‐SUIF. (g) Fluorescent staining of F‐actin in MSCs cultured with SUIF, 5B‐SUIF, 5Sr‐SUIF, and 5B5Sr‐SUIF. Image published in: Lu Y et al. (2026) Image downloaded from an Open Access article in PubMed Central. © 2026 The Author(s). Endocrinology, Diabetes & Metabolism published by John Wiley & Sons Ltd. Larger Image Printer Friendly View |