
ECB-IMG-208615
Echinobase Image ID: 208615
|
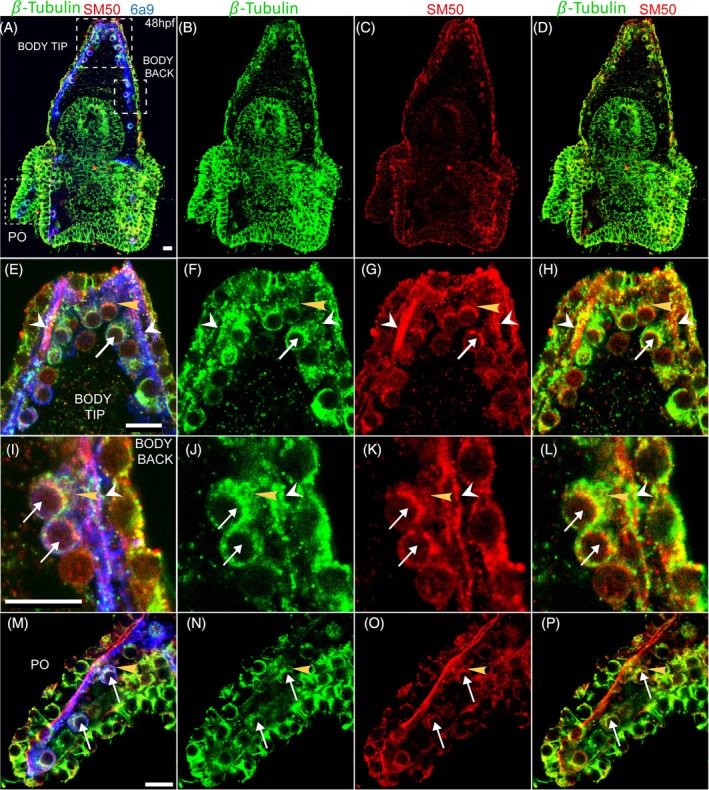
FIGURE 6. SM50 expression overlaps with the microtubule filaments within the skeletogenic lineage at 48hpf. Representative images showing sea urchin embryo stained with SM50 antibody (red), Tubulin‐β (green) and the skeletogenic cell marker 6a9 (blue) at 48hpf. (A–D) Whole embryo images. (E–H) Zoom‐in into the body‐tip rectangle in (A). (I–L) Zoom‐in into the body‐back rectangle in (A). (M–P) Zoom‐in into the post‐oral rod marked in (A). Arrows point to skeletogenic cells where SM50 is enriched at the Golgi apparatus. White arrowheads point to the mineralized spicule where SM50 signal is high. Yellow arrowheads point to regions where SM50 signal is detected along the microtubule filaments that elongate from the Golgi apparatus toward the spicule. The experiments were done in two biological replicates where the total number of embryos scored is 12. Scale bar in (A, E, I, M) is 10 μm. Image published in: Qassem A et al. (2025) Image downloaded from an Open Access article in PubMed Central. © 2025 The Author(s). Larger Image Printer Friendly View |