
ECB-IMG-208613
Echinobase Image ID: 208613
|
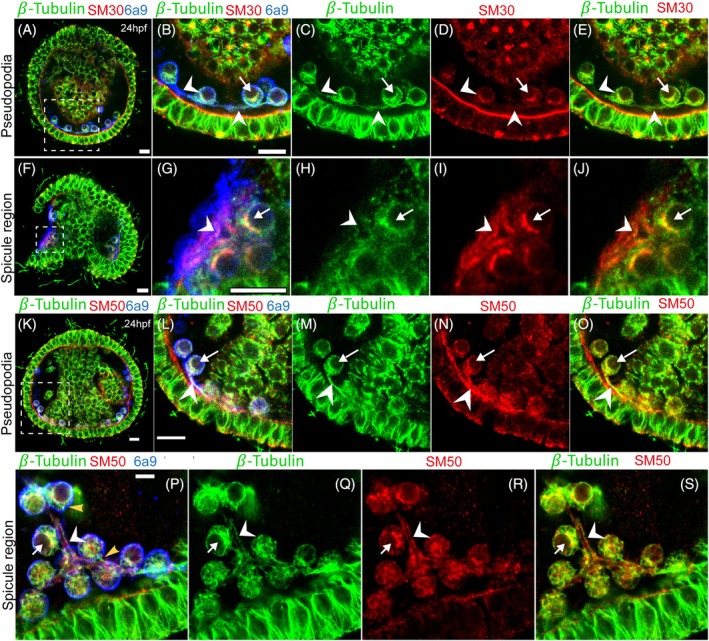
FIGURE 4. Co‐localization of microtubules with the matrix proteins SM30 and SM50 during skeletal formation at 24hpf. Representative images showing sea urchin embryo at 24hpf stained with β‐Tubulin (green), the skeletogenic cell marker 6a9 (blue) and SM30 (red, A–J) or SM50 (red, K–S). Throughout the figure, arrows point to skeletogenic cells where the spicule matrix proteins are enriched in a crescent shape around the nucleus, probably, the Golgi apparatus. (A, F) Different focal plains of the same embryo. (B–E) Zoom‐in into the mineral‐free pseudopodia cable area marked with white rectangle in (A). Arrowheads point to the pseudopodia cable with minimal SM30 signal. (G–J) Zoom‐in into the mineralized spicule area rectangle marked in (F), arrowheads point to the spicule cavity. (L–O) Zoom into the pseudopodia cable area marked with white rectangle in (K). Arrowheads point to the mineral‐free pseudopodia cable where SM50 is enriched. (P–S) Zoom into a mineralized spicule area stained with SM50. White arrowheads point to the spicule cavity where β‐Tubulin and SM50 signals overlap. The experiments were done in two biological replicates and the total number of embryos scored for SM30 is 18 and 33 for SM50. Scale bar in (A, B, F, G, K, L, P) is 10 μm. Image published in: Qassem A et al. (2025) Image downloaded from an Open Access article in PubMed Central. © 2025 The Author(s). Larger Image Printer Friendly View |