
ECB-IMG-208611
Echinobase Image ID: 208611
|
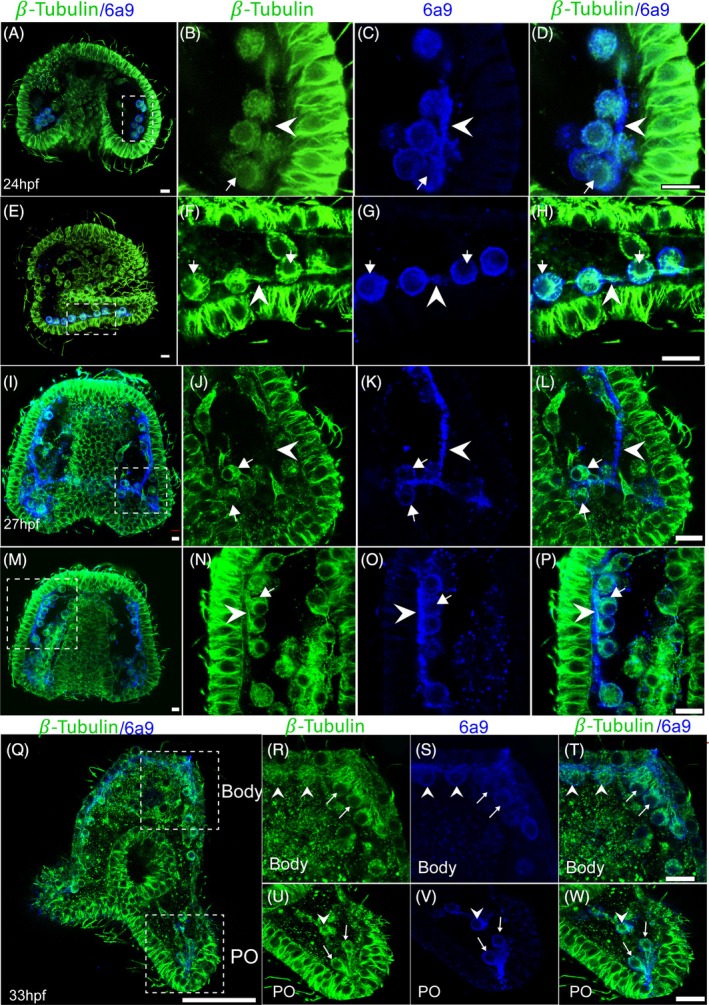
FIGURE 2. Microtubules organization in the skeletogenic lineage during spicule formation, triradiate growth and elongation. Representative images showing sea urchin embryo stained with β‐Tubulin (green) and the skeletogenic cell marker 6a9 (blue) at 24hpf (A–H), 27hpf (I–P), and 33hpf (Q–W). (A) and (E) show different focal plains of the same embryo at 24hpf. (B–D) Zoom‐in to the spicule area marked with white rectangle in (A). (F–H) Zoom‐in to the pseudopodia cable area, marked with white rectangle in (E). (I, M) Different focal plains of the same embryo at 27hpf. (J–L) Zoom‐in to the mineralized spicule area rectangle marked in I. (N–P) zoom‐in into the pseudopodia cable area marked in (M). Arrows point to skeletogenic cells where the microtubules elongate from a crescent shape around the nucleus to the cell cortex. Arrowheads point to the spicule cavity (B–D, J–L) or to the empty pseudopodia cable (F–H, N–P). (R–W) Enlargements of the areas marked with white rectangles in Q, showing the body rod region (R–T) and post‐oral rod region (U–W). Arrows point to skeletogenic cells where the microtubules are enriched in a crescent shape around the nuclei and multiple filaments elongate toward the tips of the spicule rods. Arrowheads point to skeletogenic cells away from the tips, not showing the elongated microtubule filaments. Number biological replicates and total embryos scored are, n = 3, 17 at 24hpf, n = 3, 20 at 27hpf, n = 4, 38 at 33hpf. Scale bar in (A, D, E, H, I, L, M, P, T, W) is 10 and 50 μm in (Q). Image published in: Qassem A et al. (2025) Image downloaded from an Open Access article in PubMed Central. © 2025 The Author(s). Larger Image Printer Friendly View |