
ECB-IMG-208610
Echinobase Image ID: 208610
|
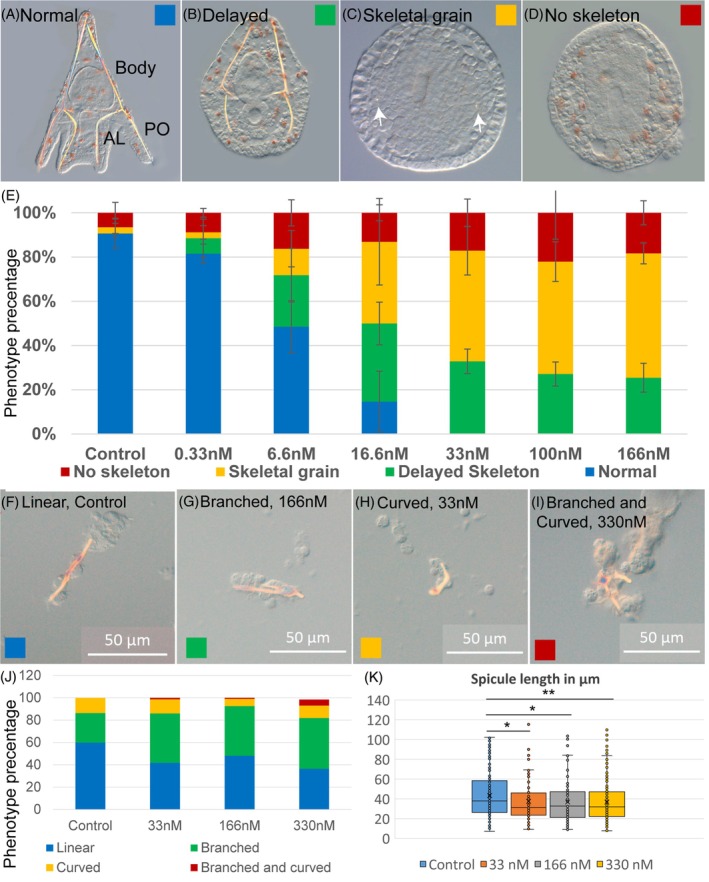
FIGURE 1. Perturbation of microtubule elongation interferes with skeletal growth. (A–E) Nocodazole treatment added at 25hpf in whole embryos, scored at 48hpf. (A) Representative control sea urchin embryo showing normal body rod, PO – post oral rod and AL – anterolateral rod. (B–D) Representative embryos treated with Nocodazole. (B) Embryo showing delay in skeletogenesis, (C) severely delayed embryo where skeletal grains are formed, and (D) malformed embryo that lacks skeleton. (E) Percentage of embryos showing the phenotypes for different Nocodazole concentrations. The number of biological replicates is n = 8 for control; n = 5 for 166, 100, and 33 nM Nocodazole, and n = 3 for 16.6, 6.6, and 0.33 nM Nocodazole. In each biological replicate, 21–66 embryos were scored. Color code matches the phenotypes presented in (A)–(D). Error bars indicate standard deviation. (F–K) Nocodazole treatment added at 48hpf in skeletogenic cell cultures scored at 72hpf. (F) Representative control linear spicule, (G) representative branched spicule under 166 nM Nocodazole treatment. (H) Representative curved spicule under 33 nM Nocodazole, (I) representative branched and curved spicule under 33 nM Nocodazole. (J) Percentage of embryos showing the phenotypes for control and different Nocodazole concentrations. (K) Measurement of spicule length in skeletogenic cell culture at 72hpf. Each box plot shows the average marked in x, the median, the first and the third quartiles (edges of boxes), and all experimental measurements (dots). Number of spicules measured n = 161 in control, n = 84 in 33 nM, n = 113 in 166 nM, and n = 189 in 330 nM Nocodazole treatment. Statistical significance was measured using a two‐tailed t‐test and * indicated p < .05, and ** p < .01. Image published in: Qassem A et al. (2025) Image downloaded from an Open Access article in PubMed Central. © 2025 The Author(s). Larger Image Printer Friendly View |