
ECB-IMG-208590
Echinobase Image ID: 208590
|
|
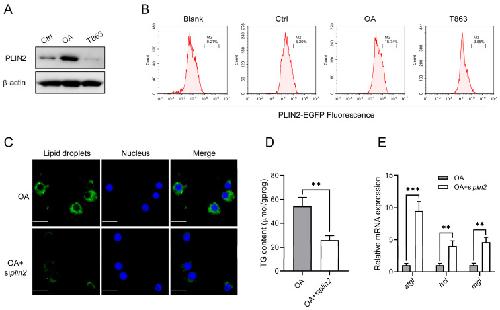
Figure 3. PLIN2 stabilizes lipid droplets by restraining lipolytic activation. (A) Coelomocytes were treated with OA or T863 for 12 h. Protein expression of PLIN2 was determined by Western blot, with β-actin as the loading control. Data represent three independent experiments. (B) HEK293T cells were transfected with the PLIN2-EGFP expression plasmid. After 24 h, cells were treated with OA or T863 for 12 h, harvested, and analyzed by flow cytometry using the FITC channel to quantify EGFP fluorescence intensity. (C–E) Coelomocytes were transfected with siNC or siplin2. After 24 h, cells were incubated with 500 μM OA for 12 h, followed by fixation and staining with BODIPY 493/503 (green) to label lipid droplets and DAPI (blue) for nucleus. Images were acquired by confocal microscopy. Scale bar = 10 μM (C). Cellular triglyceride content was measured (D), and relative mRNA expression of atgl, hsl, and mgl was detected by qRT-PCR (E). Data from at least three independent biological replicates (mean ± SD). Significantly different experimental groups: ** p < 0.01, *** p < 0.001 by Student’s t test. atgl, adipose triglyceride lipase; hsl, hormone-sensitive lipase; mgl, monoacylglycerol lipase; PLIN2, perilipin 2; OA, oleic acid. Image published in: Fan H et al. (2026) Image downloaded from an Open Access article in PubMed Central. © 2026 by the authors. Larger Image Printer Friendly View |