
ECB-IMG-208586
Echinobase Image ID: 208586
|
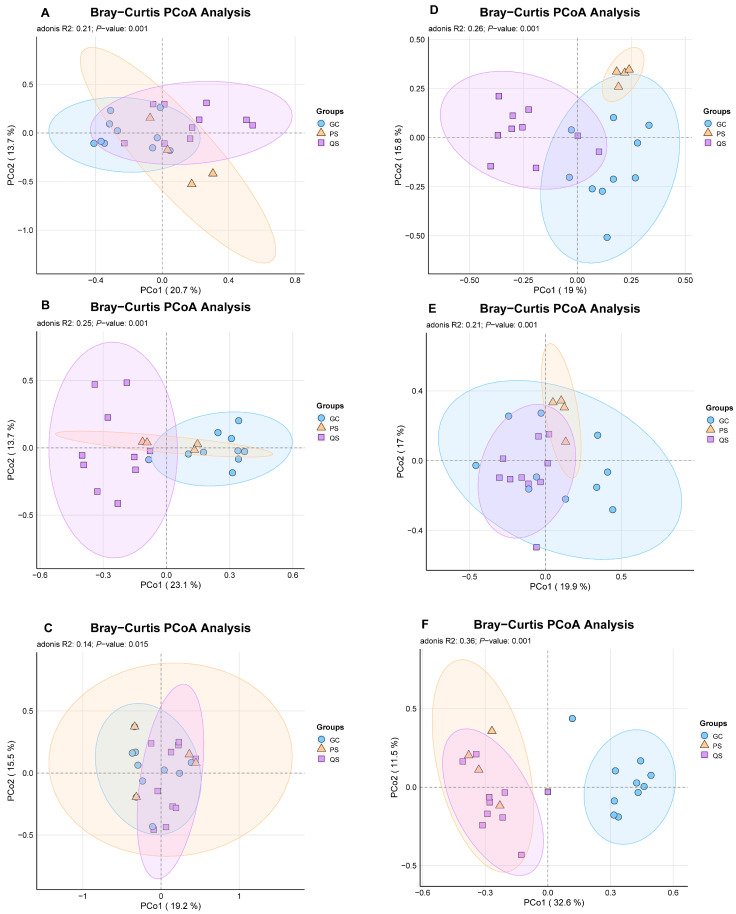
Figure 3. PCoA plots of macrobenthic communities with PERMANOVA test from 2018 to 2024. Different colors represent functional zones: purple = water intake (QS); blue = harbor basin (GC); yellow = drainage outlet (PS). (A) 2018 PCoA analysis of macrobenthic communities; (B) 2019 PCoA analysis of macrobenthic communities; (C) 2020 PCoA analysis of macrobenthic communities; (D) 2021 PCoA analysis of macrobenthic communities; (E) 2023 PCoA analysis of macrobenthic communities; (F) 2024 PCoA analysis of macrobenthic communities. Image published in: Huang W et al. (2026) Image downloaded from an Open Access article in PubMed Central. © 2026 by the authors. Larger Image Printer Friendly View |