
ECB-IMG-208582
Echinobase Image ID: 208582
|
|
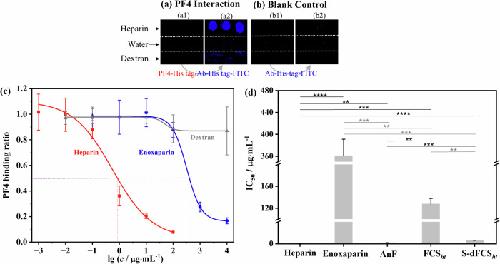
Fig. 5. The heparin microarray-based competitive strategy used for evaluating SP-induced side effects.Fluorescence images of carbohydrate microarray containing heparin, dextran, and water spots before (a1, b1) and after recognition with PF4-His tag/Ab-His tag-FITC (a2), and Ab-His tag-FITC (b2). The images were in pseudocolor, and the default color was set according to the wavelength of excitation laser. c PF4 binding ratio on heparin microarrays after PF4 preincubating with heparin, enoxaparin, and dextran solutions at different concentrations. d IC50 for heparin, enoxaparin, AnF, FCSht, and S-dFCSht on binding event of PF4 and immobilized heparin. The data were expressed as means ± SD and determined by t-test., **P < 0.01, ***P < 0.001, and ****P < 0.0001. Image published in: Wang F et al. (2026) Image downloaded from an Open Access article in PubMed Central. © The Author(s) 2026 Larger Image Printer Friendly View |