
ECB-IMG-208581
Echinobase Image ID: 208581
|
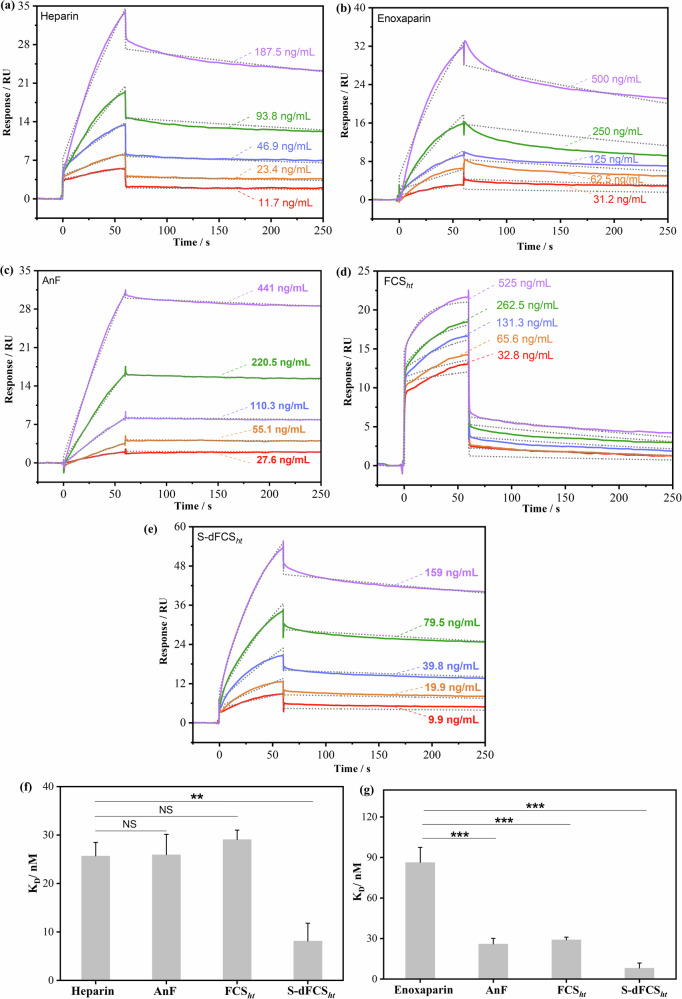
Fig. 4. SPR analysis of the affinity between SPs and AT.The typical SPR sensing curves (solid lines) and fitting curves (dotted lines) of heparin (a), enoxaparin (b), AnF (c), FCSht (d), and S-dFCSht (e) at different concentrations binding with AT. KD values for heparin-AT, enoxaparin-AT, AnF-AT, FCSht-AT, and S-dFCSht-AT specific interaction (f, g). The data were expressed as means ± SD and determined by t-test. NS not significant; **P < 0.01, ***P < 0.001. Image published in: Wang F et al. (2026) Image downloaded from an Open Access article in PubMed Central. © The Author(s) 2026 Larger Image Printer Friendly View |