
ECB-IMG-208579
Echinobase Image ID: 208579
|
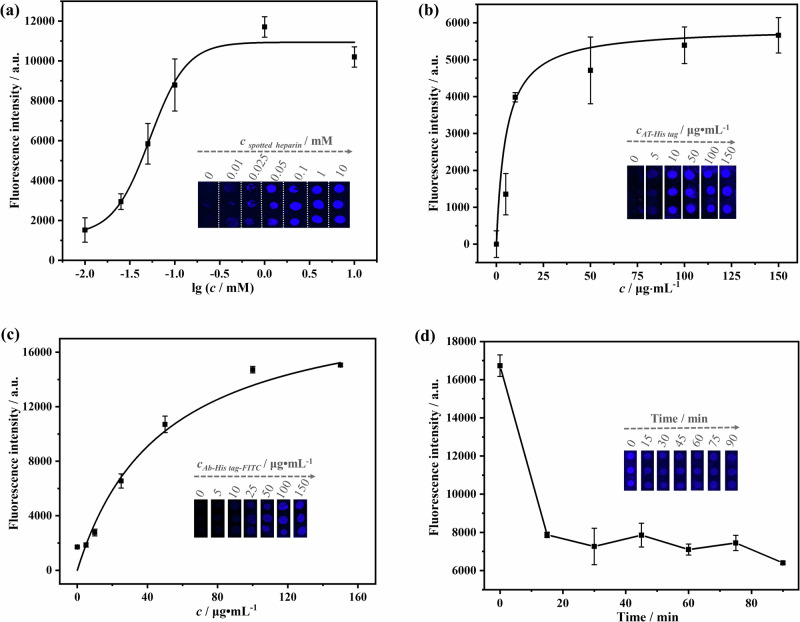
Fig. 2. Key conditions for heparin microarray-based competitive strategy for investigating SP-AT interactions.a Fluorescence images (inset) and fluorescence intensity of heparin at different spotting concentrations binding with AT-His tag (50 μg‧mL−1) then labelled with Ab-His tag-FITC (100 μg‧mL−1). b Fluorescence images (inset) and fluorescence intensity of immobilized heparin binding with AT-His tag at different concentrations then labelled with Ab-His tag-FITC (100 μg‧mL−1). c Fluorescence images (inset) and fluorescence intensity of immobilized heparin binding with AT (50 μg‧mL−1) then labelled with Ab-His tag-FITC at different concentrations. d Fluorescence images (inset) and fluorescence intensity of immobilized heparin binding with remaining AT-His tag then labelled with Ab-His tag-FITC after AT-His tag preincubating with heparin solution (50 μg‧mL−1) for different time. Image published in: Wang F et al. (2026) Image downloaded from an Open Access article in PubMed Central. © The Author(s) 2026 Larger Image Printer Friendly View |