
ECB-IMG-208578
Echinobase Image ID: 208578
|
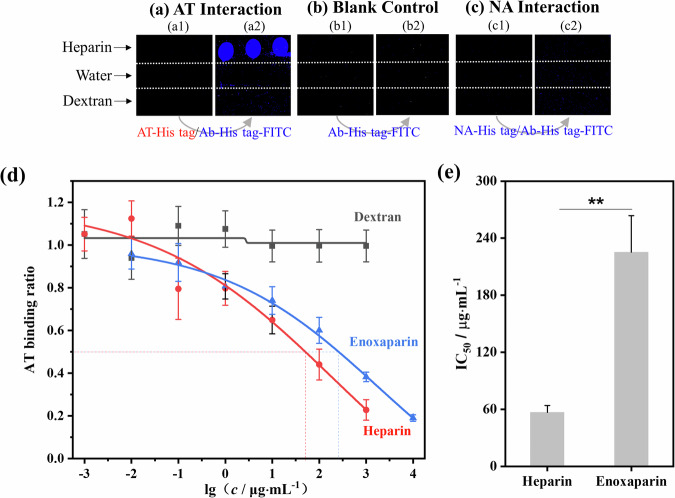
Fig. 1. Heparin microarray-based competitive strategy for investigating SPs and AT specific interactions was feasible.Fluorescence images of carbohydrate microarray containing heparin, dextran, and water spots before (a1, b1, and c1) and after recognition with AT-His tag/Ab-His tag-FITC (a2), Ab-His tag-FITC (b2), or NA-His tag/Ab-His tag-FITC (c2). The images were in pseudocolor, and the default color was set according to the wavelength of excitation laser. d AT binding ratio on heparin microarrays after AT preincubating with heparin, enoxaparin, or dextran solutions at different concentrations. e IC50 values of heparin or enoxaparin on AT-immobilized heparin binding events. The data were expressed as means ± standard deviation (SD) and determined by t-test. NS not significant; **P < 0.01. Image published in: Wang F et al. (2026) Image downloaded from an Open Access article in PubMed Central. © The Author(s) 2026 Larger Image Printer Friendly View |