
ECB-IMG-208576
Echinobase Image ID: 208576
|
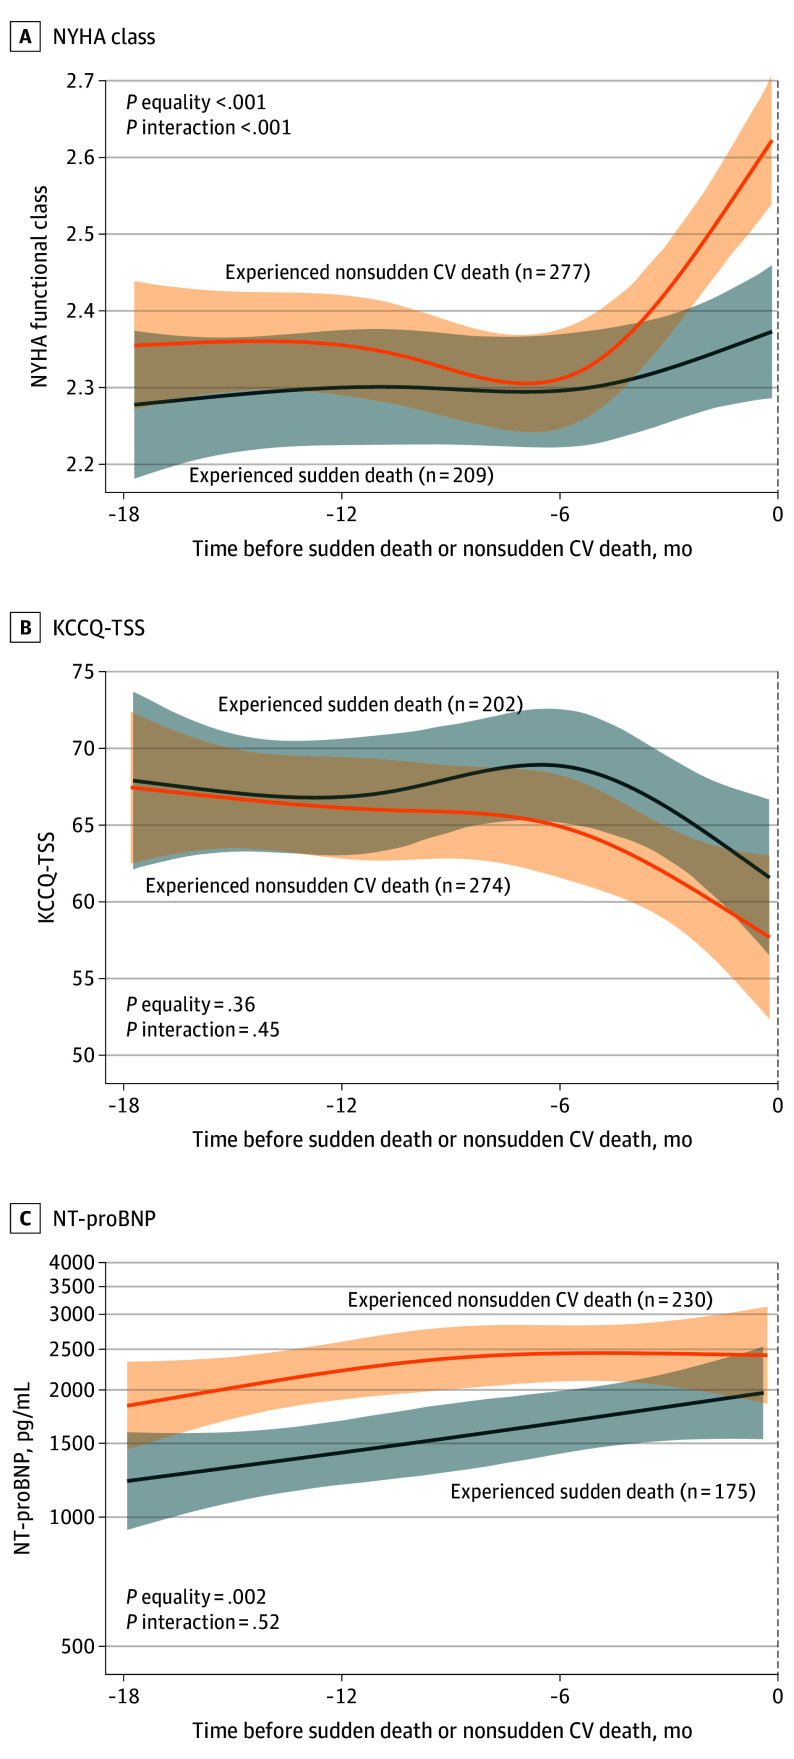
Figure 3. . Cubic Splines Depicting Trajectories in the Period Preceding Sudden Death vs Nonsudden Cardiovascular DeathA, New York Heart Association (NYHA) functional class. B, Kansas City Cardiomyopathy Questionnaire Total Symptom Score (KCCQ-TSS). C, N-terminal pro–B-type natriuretic peptide (NT-proBNP) level. The dashed line denotes timing of sudden death or nonsudden cardiovascular (CV) death. The shading represents 95% CIs. The number in parentheses is the number of patients in each group who had the parameter measured at least once within 18 months before sudden death or nonsudden CV death. P equality assesses whether the trajectories over time were identical (ie, superimposable). P interaction assessed whether the trajectories differed in shape over time (ie, nonparallel trajectories reflecting a group × time interaction). Image published in: Lu H et al. (2026) Image downloaded from an Open Access article in PubMed Central. Copyright 2026 Lu H et al. JAMA Cardiology. Larger Image Printer Friendly View |