
ECB-IMG-197730
Echinobase Image ID: 197730
|
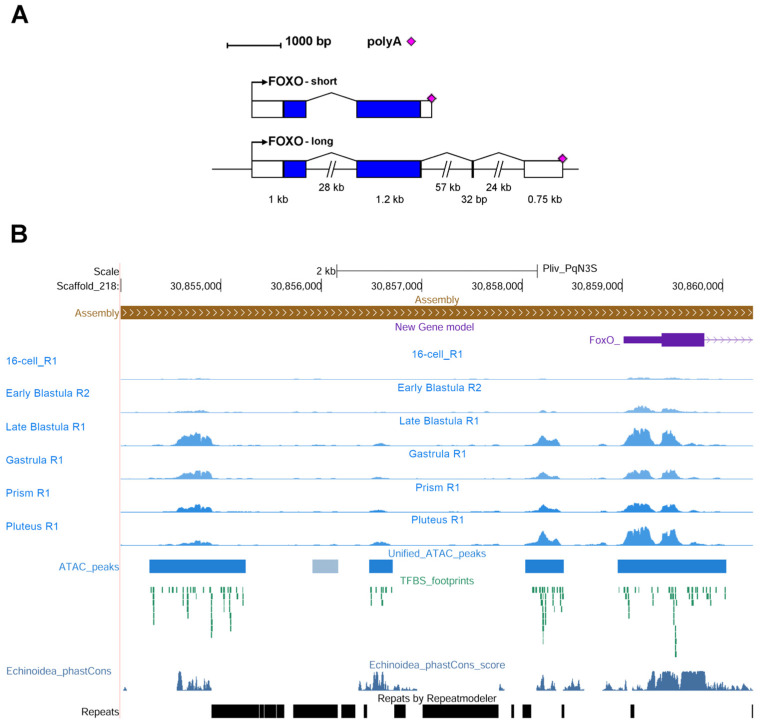
Figure 1. Pl-foxo gene analysis. (A) Intron–exon structure of the Pl-foxo gene showing the two possible alternative splicings that result in short and long mRNA isoforms. Rectangles represent exons: white rectangles represent 5′UTR and 3′UTR sequences, and colored rectangles represent coding sequences. Numbers below the black lines and rectangles indicate the size (kb/bp) of the corresponding introns or exons, respectively. Pink diamonds represent the putative polyadenylation sites. (B) The regulatory region around the Pl-foxo gene promoter is visualized as tracks in the UCSC genome browser. The first exon of Pl-foxo is shown in purple, ATAC-seq signals and peaks are shown in blue, transcription factor binding sites (TFBS) are in green, conserved sequences in Echinoidea are in dark blue and repeats are in black. Image published in: Russo R et al. (2024) Image downloaded from an Open Access article in PubMed Central. © 2024 by the authors. Larger Image Printer Friendly View |