
ECB-IMG-197501
Echinobase Image ID: 197501
|
|
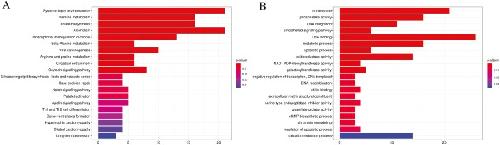
Figure 3. (A) KEGG pathway enrichment analysis of significantly expanded gene families. The horizontal axis represents the number of genes, the vertical axis represents the KEGG Pathway, and the colour indicates the q-value. A smaller q-value indicates a more significant enrichment result. (B) GO enrichment analysis of significantly expanded gene families. The horizontal axis represents the number of genes, the vertical axis represents the Gene Ontology functional categories, and the colour indicates the q-value. A smaller q-value indicates a more significant enrichment result. Image published in: Huang Z et al. (2024) Image downloaded from an Open Access article in PubMed Central. © The Author(s) 2024. Published by Oxford University Press GigaScience. Larger Image Printer Friendly View |