
ECB-IMG-194700
Echinobase Image ID: 194700
|
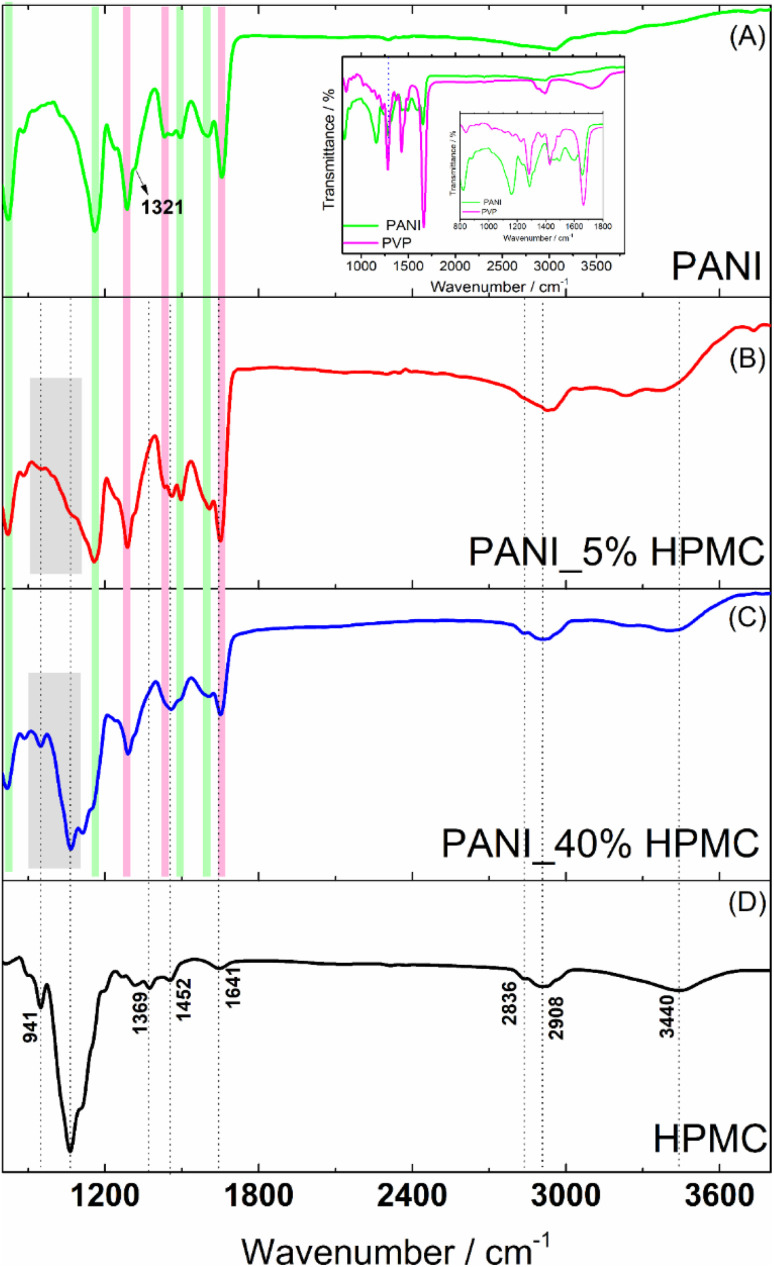
Fig. 4. FTIR spectra of PANI (green), PANI_5%HPMC (red) and PANI_40%HPMC (blue) and HPMC (black). Larger Image Printer Friendly View |
|
|
Fig. 4. FTIR spectra of PANI (green), PANI_5%HPMC (red) and PANI_40%HPMC (blue) and HPMC (black). Larger Image Printer Friendly View |