
ECB-IMG-190558
Echinobase Image ID: 190558
|
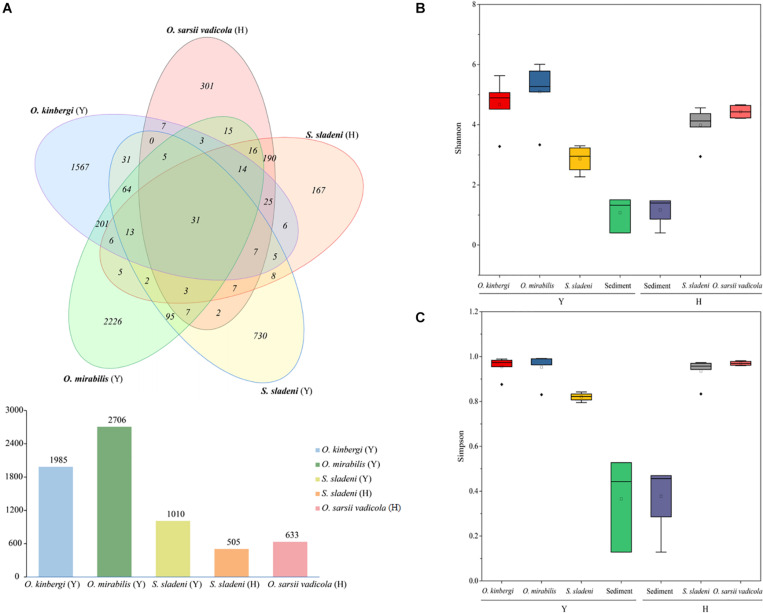
FIGURE 3. Amplicon sequence variant (ASV) Venn diagram of gut microbiota of ophiuroids and alpha diversity analyses of the ophiuroid gut and sediment microbial communities. (A) ASVs of ophiuroids’ gut microbiota are depicted in a Venn diagram. Alpha diversity was calculated using (B) the Shannon index and (C) the Simpson index. Statistical analysis was conducted on alpha diversity using Mann–Whitney U tests. ns, not significant; p > 0.05. Y, the nearshore environment; H, the offshore environment. Image published in: Dong Y et al. (2021) Image downloaded from an Open Access article in PubMed Central. Copyright © 2021 Dong, Li, He, Wang, Fan, Zhang, Zhang and Xu. Larger Image Printer Friendly View |