
ECB-IMG-190335
Echinobase Image ID: 190335
|
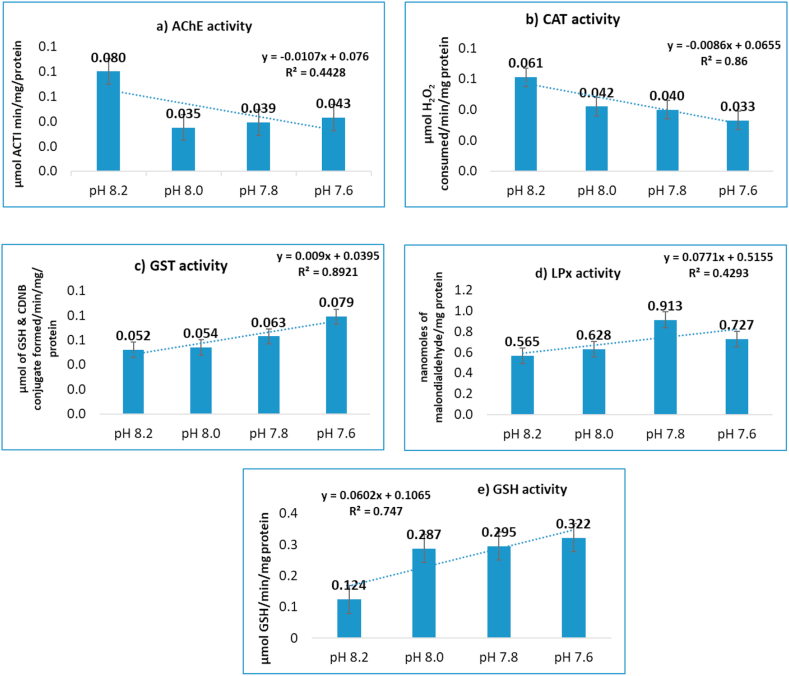
Figure 6. Physiological responses in gut tissues of S. virgulata at different pH exposure; a) AChE activity b) CAT activity c) GST activity d) LPx activity and e) GSH activity. Image published in: Anand M et al. (2021) Image downloaded from an Open Access article in PubMed Central. © 2021 Published by Elsevier Ltd. Larger Image Printer Friendly View |