
ECB-IMG-189760
Echinobase Image ID: 189760
|
|
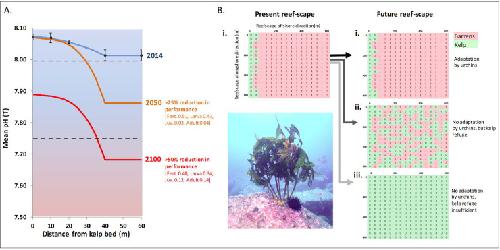
Fig 5. Modelling future phase-shifts under different scenarios of adaptation by sea urchins to ocean acidification.(A) Spatial dynamics of pH proximate to kelp beds in 2014 (means ± SE, n = 4 per sample position) and projected under OA business as usual (RCP8.5) for years 2050 and 2100; dashed horizontal lines indicate thresholds for compromised performance of sea urchins at 25% (light grey) and 50% (black) (S5 Fig in S1 File); numbers in parentheses indicate proportional contribution by each life-history stage to the compounded decline in sea urchin performance across life-history stages. (B) Conceptualization of present-day (i) and future reef-scapes under OA (green cells â0â = kelp; pink cells â1â = urchin barren); (i) maintenance of present-day configuration due to adaptation by urchins, i.e. extensive barrens and narrow fringing kelp beds in the shallows; (ii) emergent mosaicked kelp/ barrens future simulated by cellular automaton of barrens persistence within 40 m of kelp refuge with nil adaptation by urchins (from 4A.); (iii) extensive kelp beds due to nil adaptation by urchins and insufficient kelp refuge from OA. Simulated reef-scapes run alongshore in the direction of the y-axis; and offshore in the direction of the x-axis; and are a total of 640 m by 640 m with each cell 40 m by 40 m. Inset image shows urchin at the base of a remnant kelp patch at St. Helens Island study site. Image published in: Ling SD et al. (2020) Image downloaded from an Open Access article in PubMed Central. © 2020 Ling et al Larger Image Printer Friendly View |