
ECB-IMG-185769
Echinobase Image ID: 185769
|
|
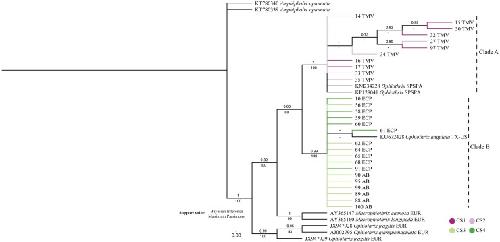
Fig 4. Cladogram inferred from the Bayesian analysis of 16S and COI sequences (concatenated).The numbers above the branches represent posterior probabilities. For the clades also inferred in the MP analysis, bootstrap values (%) are provided (below the branches). Branches are identified by individual codes (S3 Table) and their localities: AB: Araçá Bay, São Paulo, Brazil; ECP: Estuarine Complex of Paranaguá, Paraná, Brazil; EUR: Europe; SPSPA: São Pedro and São Paulo Archipelago, Brazil; TMV: Trindade and Martin Vaz Oceanic Archipelago; TX-US: Texas, United States. The scale bar represents the average nucleotide substitutions per site. Asterisks (*) indicate that the support value was lower than 0.7 (Bayesian Inference) or 70% (Maximum Parsimony), and a dash (-) indicates that the branch was not recovered in MP analysis. Image published in: Alitto RADS et al. (2019) Image downloaded from an Open Access article in PubMed Central. © 2019 Alitto et al Larger Image Printer Friendly View |