
ECB-IMG-185184
Echinobase Image ID: 185184
|
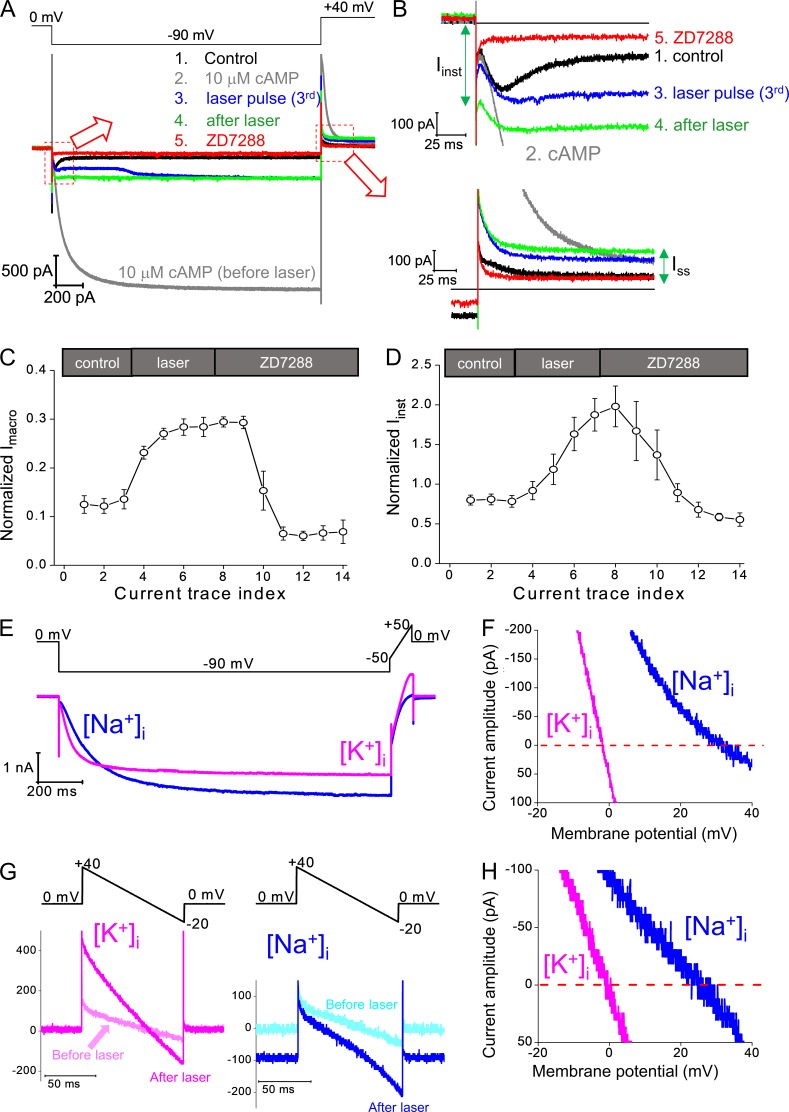
Figure 2. Ih and Iinst share similar sensitivity to ZD7288, an HCN channelâspecific blocker, and K+/Na+ selectivity. (A) Top: Voltage protocol. Bottom: Four current traces in sequence showing control (no cAMP), 10 µM cAMP, the third trace with laser pulse (with 1 µM FITC-cAMP), after laser pulses stopped and washing off FITC-cAMP, and ZD7288 (100 µM). (B) Zoomed views showing the Iinst (top) and the Ih(tail) and Iss (bottom). (C) Averaged results showing that laser pulses applied in the presence of FTIC-cAMP increase the amplitude of Imacro, which can be blocked by ZD7288. (D) Averaged results showing that laser pulses applied in the presence of FTIC-cAMP increase the amplitude of Iinst, which can also be blocked by ZD7288. Error bars represent SEM. (E) Top: Voltage protocol for Ih activation (0 to â90 mV) and a voltage ramp (â50 to 50 mV) used for the measurement of reversal potential before light pulses. Bottom: Current traces recording from the same membrane patch with symmetrical [K+]in/[K+]out (magenta) or [Na+]in/[K+]out (blue). 10 µM cAMP was added to the bath solution on the intracellular side. (F) Cross-plot of current amplitude versus membrane potential during the voltage ramp for Ih. Averaged results: 1.3 ± 0.3 mV (K+i); â27.8 ± 1.2 mV (Na+i); n = 4. (G) Top: A voltage ramp (+40 to â20 mV) was used for the measurement of reversal potential of Iinst. Bottom: Current traces recorded from the same membrane patch with symmetrical [K+]in/[K+]out (magenta, left) or [Na+]in/[K+]out (blue, right). Current traces in light colors are recorded before laser pulses and mainly caused by nonspecific leak conductance. Current traces in dark colors are recorded after laser pulses stopped and in the absence of FITC-cAMP. (H) Cross-plot of current amplitude versus membrane potential during the voltage ramp for the Iinst after laser pulses. Averaged results: 0.9 ± 0.2 mV (K+i); â26.5 ± 0.9 mV (Na+i); n = 4. Image published in: Idikuda V et al. (2018) Image downloaded from an Open Access article in PubMed Central. © 2018 Zhou et al. Larger Image Printer Friendly View |