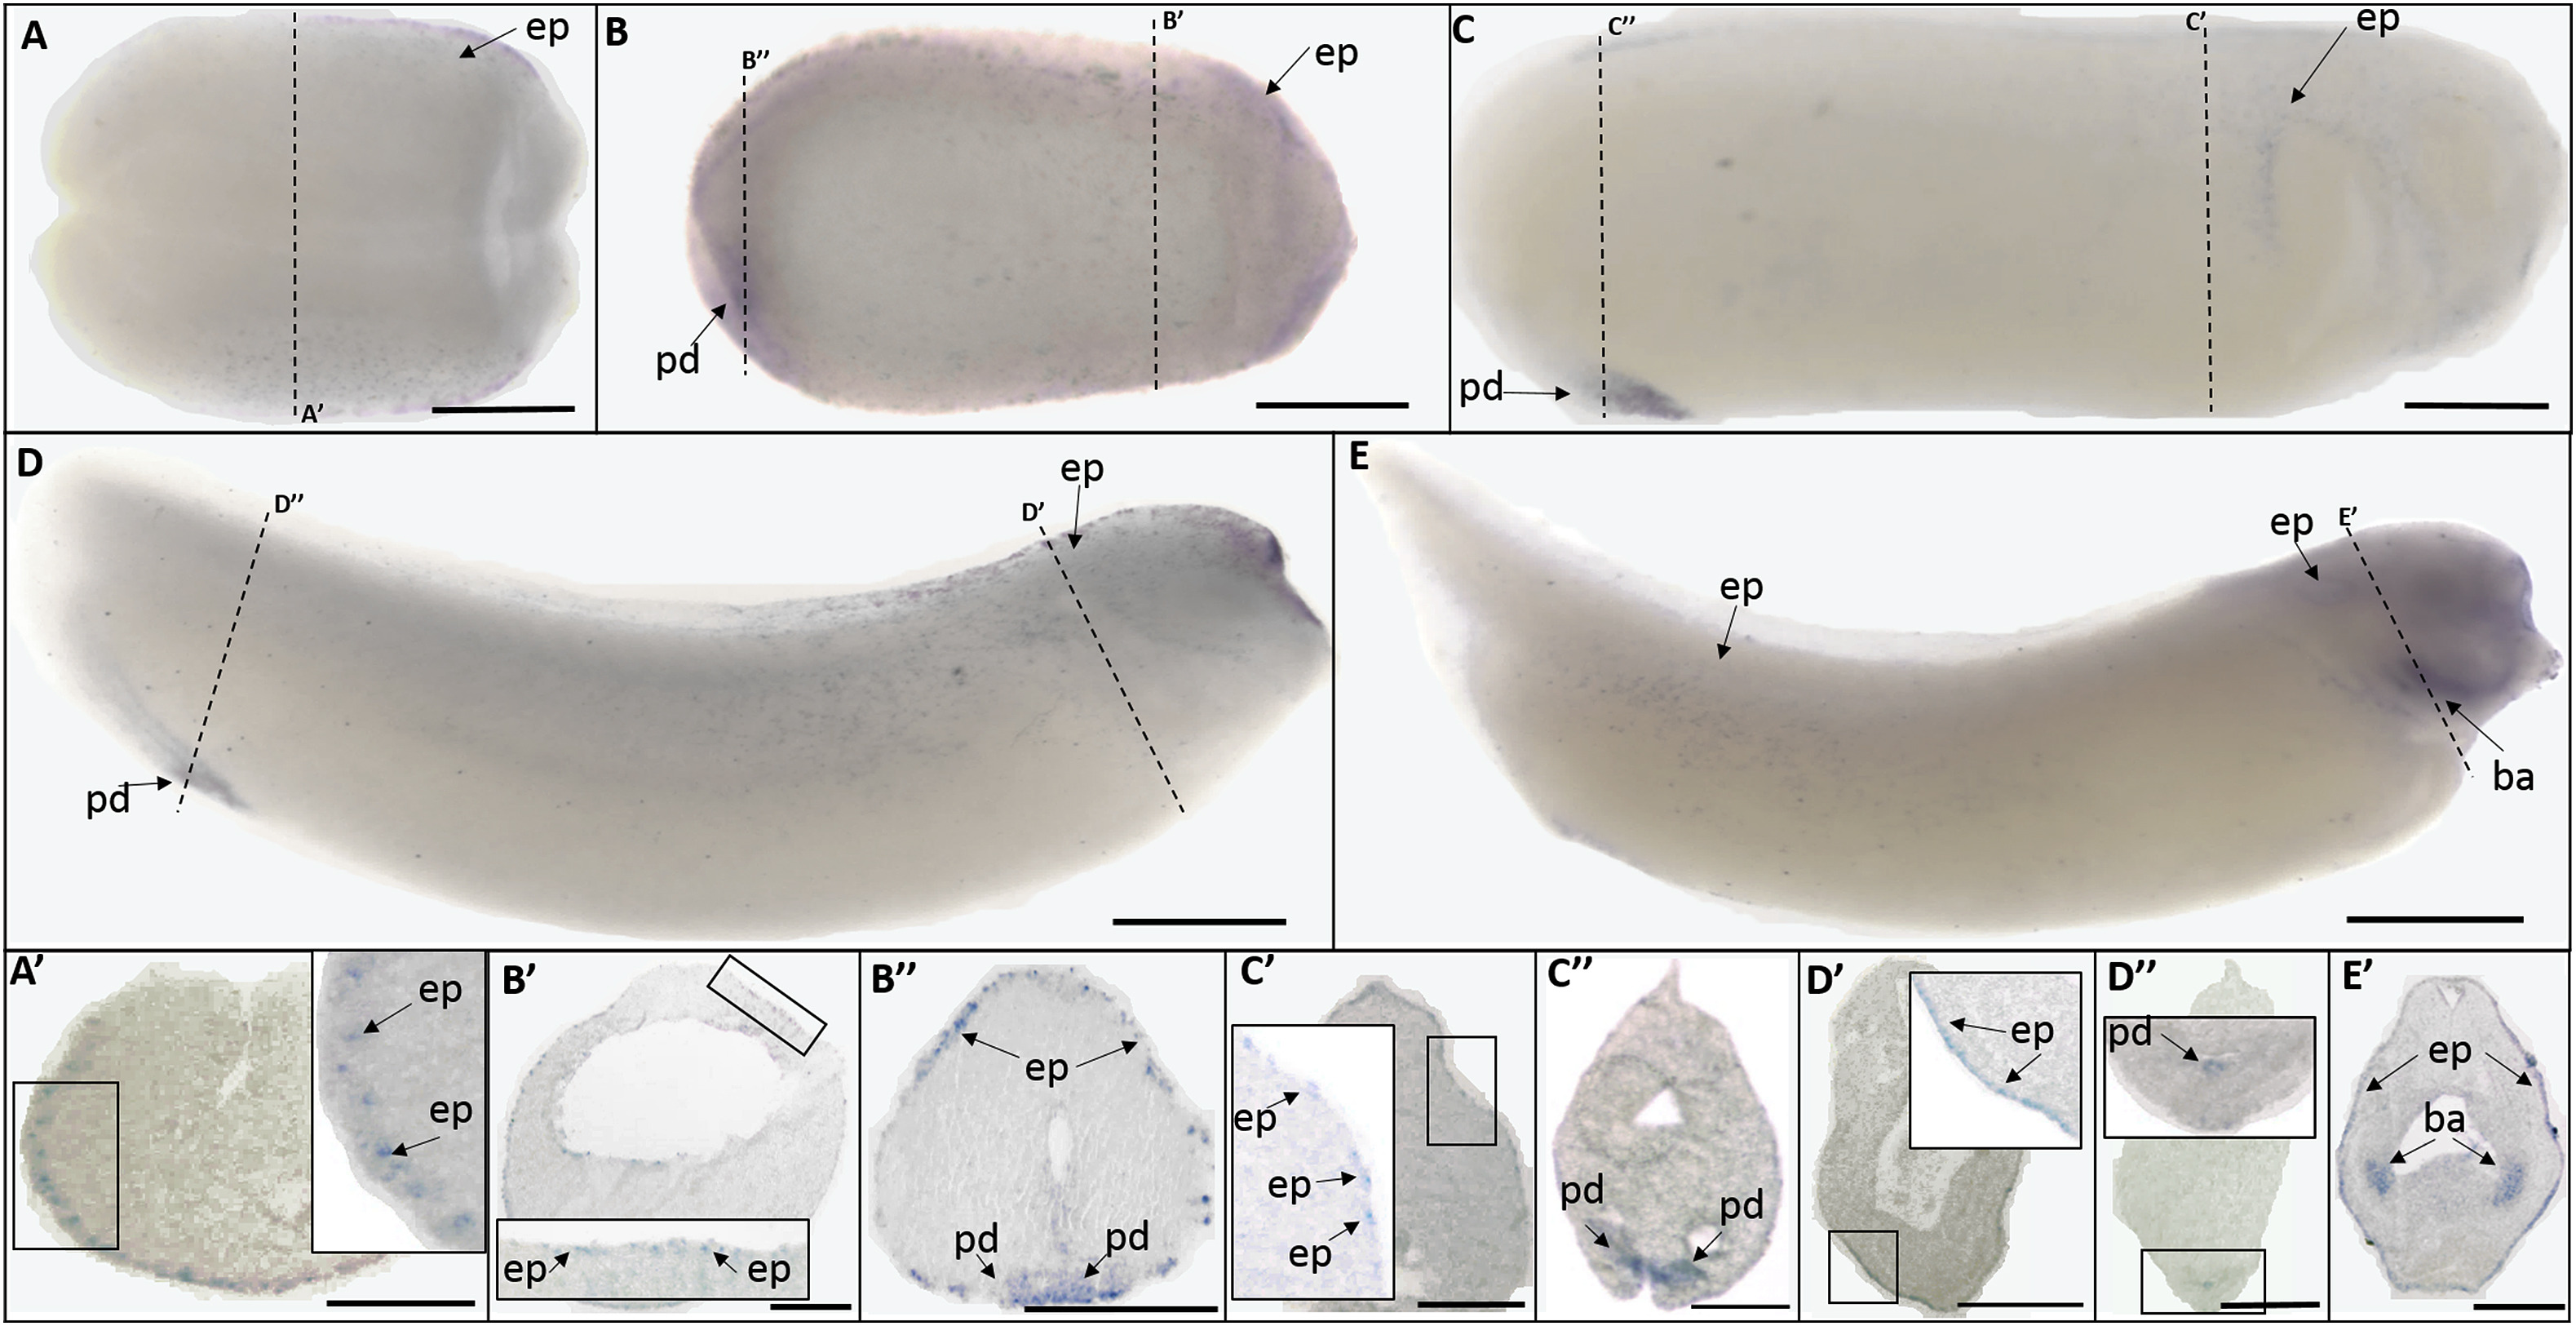
Fig. 4. Whole mount (AâE) and histological (Aâ²-Eâ²) expression of trpv5 transcripts in developing X. laevis embryos. (A) dorsal view, (BâE) lateral view, anterior to the right for all whole mount embryos; dorsal to the top for all histology images. (A, Aâ²) stage 15 (mid-neurula stage); (B, Bâ², Bâ²) stage 20 (late neurula stage); (C, Câ², Câ²) stage 25 (early tailbud stage); (D, Dâ², Dâ²) stage 30 (late tailbud stage); (E, Eâ²) stage 35 (swimming tadpole stage). Arrows indicate regions of gene expression (ba, branchial arches; ep, epidermis; pd, proctodeum). Dashed lines represent positions of corresponding sections. Scale barsâ¯=â¯250â¯Î¼m.
Image published in: Dong C et al. (2018)
Copyright © 2018. Image reproduced with permission of the Publisher, Elsevier B. V.
| Gene | Synonyms | Species | Stage(s) | Tissue |
|---|---|---|---|---|
| trpv5.L | ecac1, otrpc3 | X. laevis | Throughout NF stage 15 | epidermis |
| trpv5.L | ecac1, otrpc3 | X. laevis | Throughout NF stage 21 | proctodeum epidermis |
| trpv5.L | ecac1, otrpc3 | X. laevis | Throughout NF stage 25 | epidermis proctodeum |
| trpv5.L | ecac1, otrpc3 | X. laevis | Throughout NF stage 29 and 30 | proctodeum epidermis |
| trpv5.L | ecac1, otrpc3 | X. laevis | Throughout NF stage 35 and 36 | epidermis branchial arch |
Image source: Published
Permanent Image Page
Printer Friendly View
XB-IMG-174475