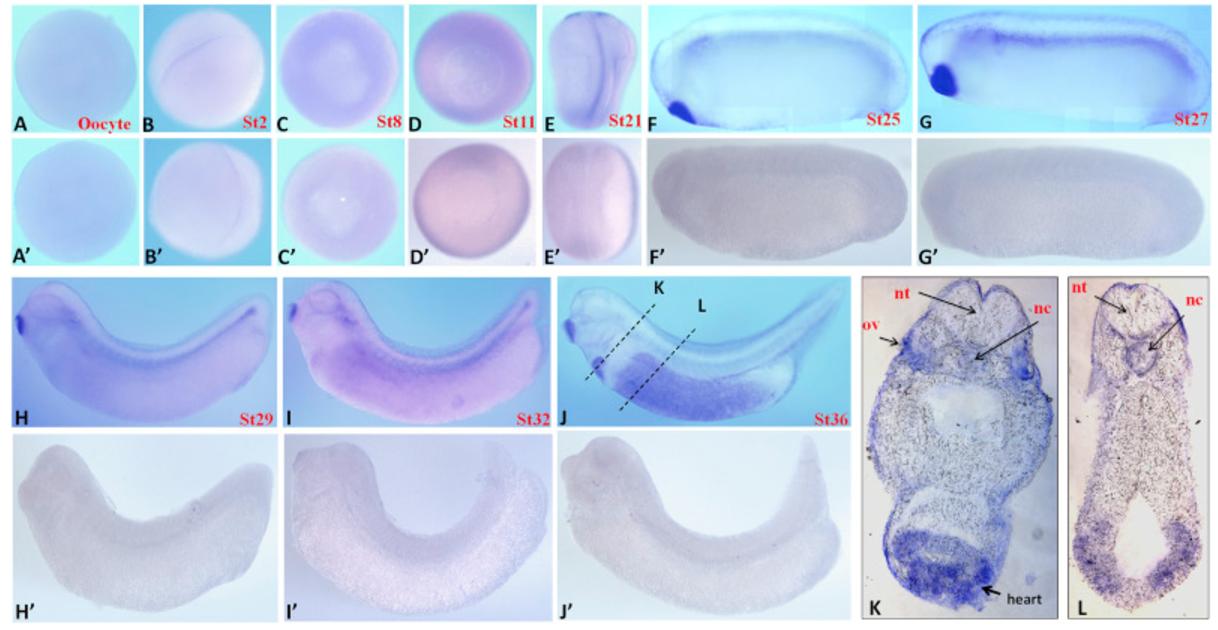
Fig. 2. Spatial patterns of rrbp1a [rrbp1.L] analyzed by whole mount in situ hybridization. (A and Aâ²) Oocyte. (B and Bâ²) Stage 2, animal view. (C and Câ²) Stage 8, animal view. (D and Dâ²) Stage 11, vegetal view. (E and Eâ²) Stage 21, dorsal view. (F and Fâ²) Stage 25, lateral view. (G and Gâ²) Stage 27, dorsal view. (H and Hâ²) Stage 29, lateral view. (I and Iâ²) Stage 32, lateral view. (J and Jâ²) Stage 36, lateral view. (K and L) Transverse sections of embryos at the levels illustrated by black broken lines in J. Nc, notochord; nt, neural tube; ov, otic vesicle. Aâ²-Jâ² indicates the sense probe control.
Image published in: Liu GH et al. (2017)
Copyright © 2017. Image reproduced with permission of the Publisher, Elsevier B. V.
| Gene | Synonyms | Species | Stage(s) | Tissue |
|---|---|---|---|---|
| rrbp1.L | X. laevis | Throughout NF stage 21 | cement gland axial mesoderm | |
| rrbp1.L | X. laevis | Sometime during NF stage 25 to NF stage 27 | notochord axial mesoderm | |
| rrbp1.L | X. laevis | Sometime during NF stage 29 and 30 to NF stage 32 | cement gland notochord otic vesicle periocular region chordoneural hinge | |
| rrbp1.L | X. laevis | Throughout NF stage 35 and 36 | cement gland notochord heart endoderm foregut |
Image source: Published
Permanent Image Page
Printer Friendly View
XB-IMG-154437