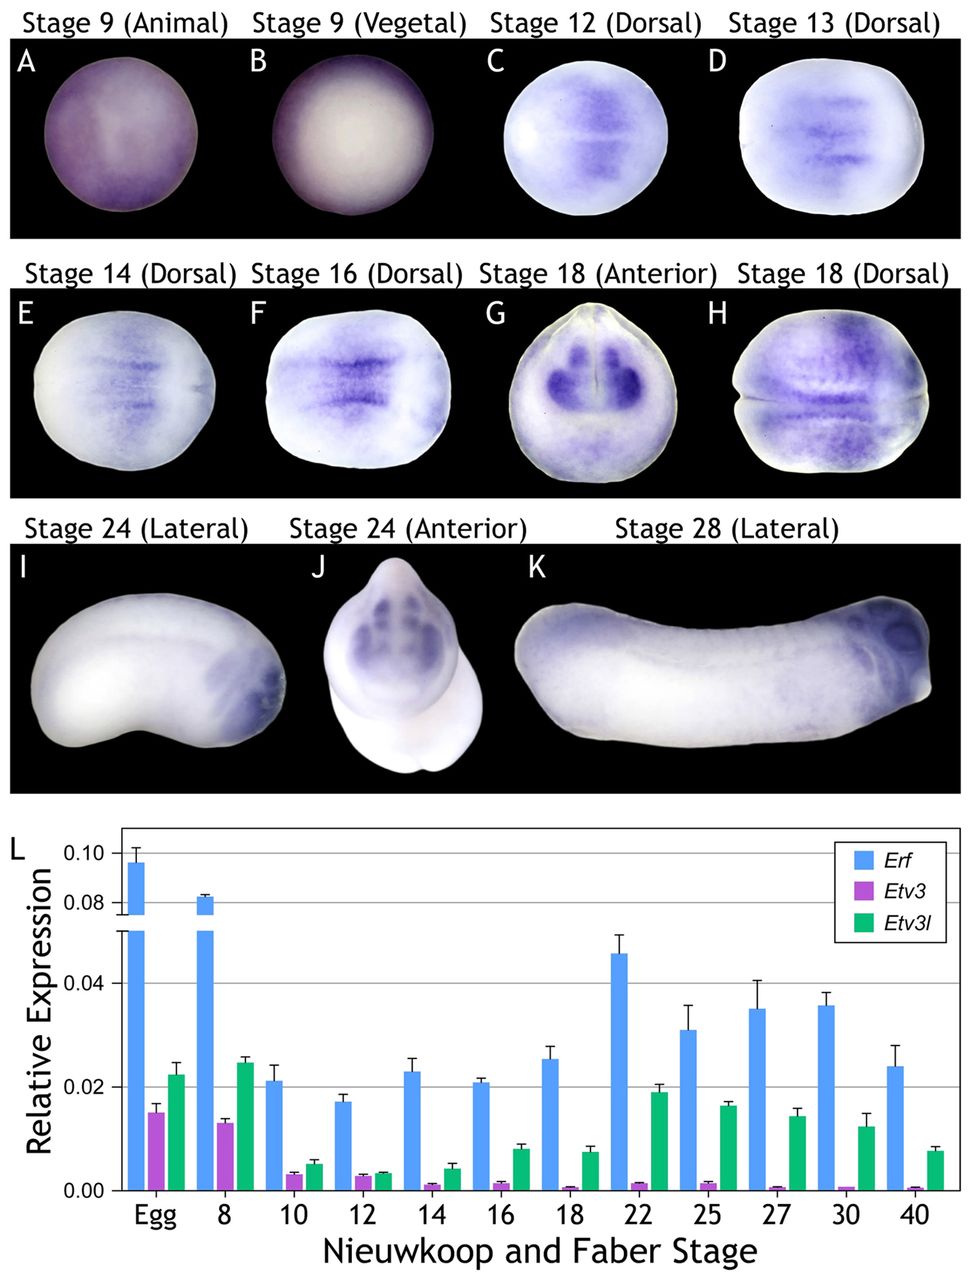
Fig. 3. Expression of Erf, Etv3 and Etv3l across developmental time. (A-K) Whole-mount in situ hybridization of Erf mRNA expression at developmental stages 9, 12, 13, 14, 16, 18, 24 and 28. Dorsal and lateral views are shown with anterior towards the right. (L) QPCR showing Erf, Etv3 and Etv3l gene expression over developmental time. The y-axis represents 2-δCt values, adjusted for primer efficiency (Pfaffl, 2001), normalized to the reference gene Histone H4.
Image published in: Janesick A et al. (2013)
Copyright © 2013. Image reproduced with permission of the Publisher.
| Gene | Synonyms | Species | Stage(s) | Tissue |
|---|---|---|---|---|
| erf.S | X. laevis | Sometime during NF stage 12 to NF stage 16 | neuron neural plate | |
| erf.S | X. laevis | Sometime during NF stage 18 to NF stage 24 | brain midbrain eye neural plate border optic vesicle eye primordium cranial neural crest mandibular crest hyoid crest branchial crest | |
| erf.S | X. laevis | Throughout NF stage 28 | brain midbrain eye pharyngeal arch mandibular arch hyoid arch branchial arch optic vesicle | |
| erf.S | X. laevis | Throughout NF stage 9 | animal hemisphere |
Image source: Published
Permanent Image Page
Printer Friendly View
XB-IMG-145166