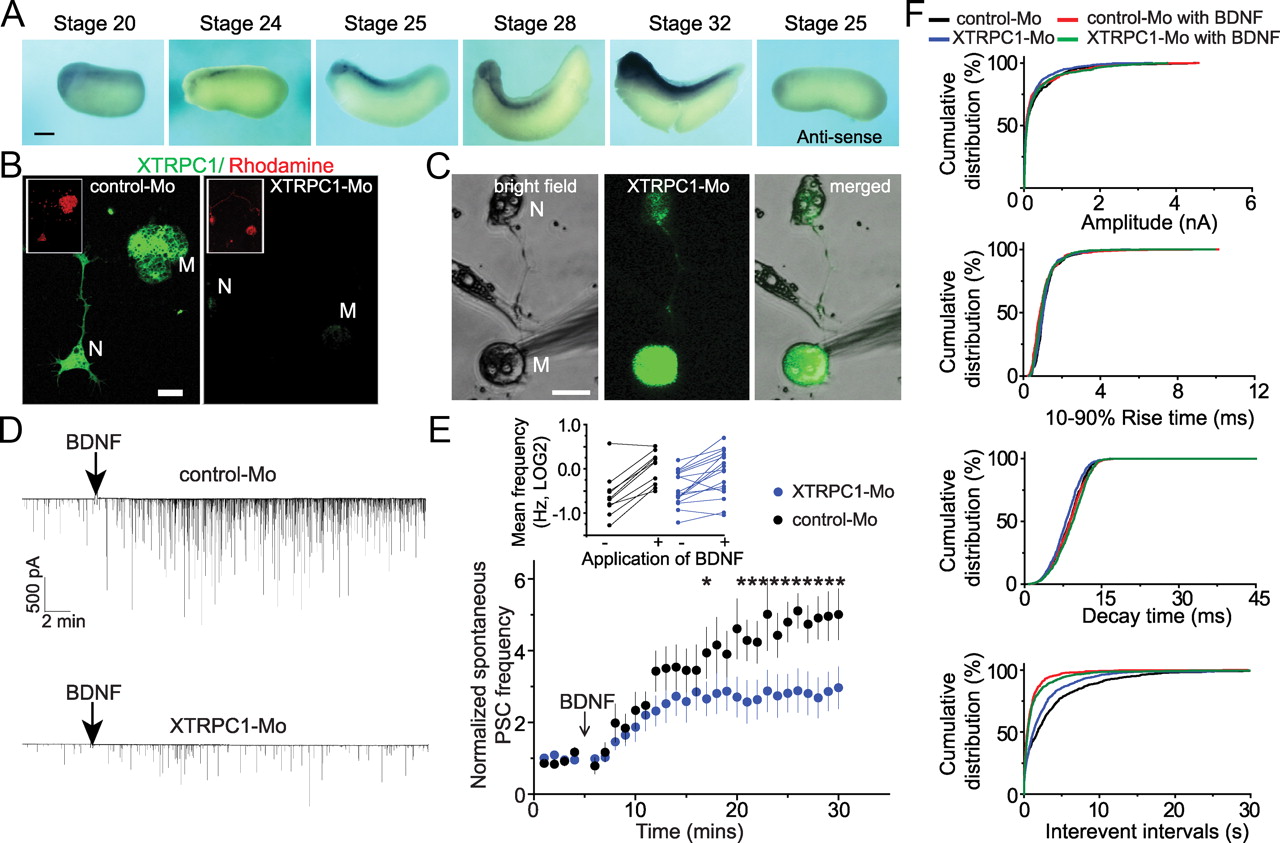
Figure 1. XTRPC1 function is required for BDNF-induced synaptic potentiation at the developing NMJ in culture. A, Sample images of whole-mount in situ hybridization of XTRPC1 in stage 20â32 Xenopus embryos. Scale bar, 0.5 mm. B, Sample images of immunostaining of XTRPC1 (green) in neuron (N)âmyocyte (M) cocultures from embryos coinjected with rhodamine dextran (red) and a specific morpholino against XTRPC1 (XTRPC1-Mo) or a control morpholino (Control-Mo). Scale bar, 10 μm. C, Sample images of recording from a neuron (N) and myocyte (M) pair, both derived from XTRPC1-Mo-injected embryos, as indicated by the presence of fluorescent lineage tracer (green). Scale bar, 20 μm. D, Sample electrophysiological recording traces from control-Mo (top) and XTPRC1-Mo pairs (bottom). Scale bars, 500 pA and 2 min. The addition of BDNF (50 ng/ml; final bath concentration) is indicated by the arrow. E, Fold changes in the frequency of spontaneous PSCs. Values represent mean ± SEM; *p < 0.05 (unpaired two-tailed Student's t test with Welch's correction). Inset: Mean frequency of spontaneous PSCs before and after BDNF application of individual cells plotted in Log2 scale. F, Cumulative distribution plots for the amplitude, 10â90% rise time, decay time, and interevent intervals (p < 0.01; KolmogorovâSmirnov test) of spontaneous PSCs of control-Mo and XTRPC1-Mo pairs before and after the BDNF application (50 ng/ml).
Image published in: McGurk JS et al. (2011)
Copyright © 2011. OA ARTICLE, images redisplayed under a Creative Commons license.
| Gene | Synonyms | Species | Stage(s) | Tissue |
|---|---|---|---|---|
| trpc1.L | xtrpc1 | X. laevis | Sometime during NF stage 20 to NF stage 32 | central nervous system brain spinal cord cranial nerve |
Image source: Published
Permanent Image Page
Printer Friendly View
XB-IMG-144586