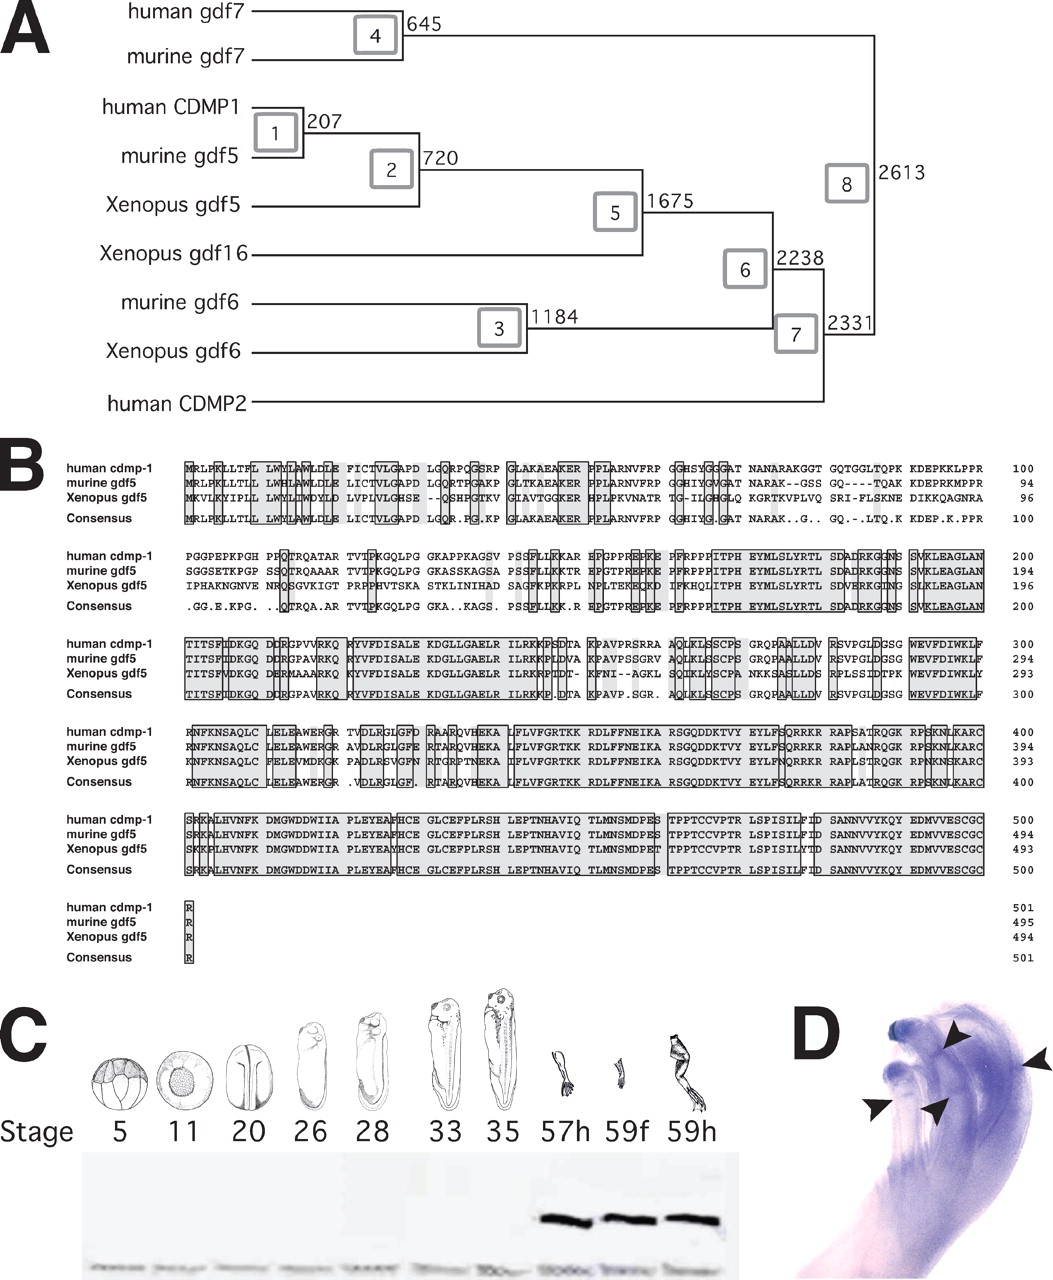
FIGURE 1. Characterization and expression analysis of Xenopus GDF5. A, dendrogram showing the phylogenetic relationship between members of the GDF5, -6, -7, and -16 subfamily. Full-length amino acid sequences were analyzed using GeneWorks® Version 2.2 (IntelliGenetics, Inc.) software. B, amino acid sequence comparison of full-length human, mouse, and Xenopus GDF5. Sequence identities are boxed; sequence similarities are highlighted in gray. C, RT-PCR analysis for Xenopus GDF5 using RNA obtained from indicated stages of Xenopus development (h = hindlimb; f = forelimb). D, whole mount hybridization in situ of Xenopus GDF5 of a stage 59 Xenopus forelimb. Arrows indicate the location of positive signal at presumptive joint interzones.
Image published in: Thomas JT et al. (2006)
Copyright © 2006. Image reproduced with permission of the Publisher.
| Gene | Synonyms | Species | Stage(s) | Tissue |
|---|---|---|---|---|
| gdf5.L | CDMP1, gdf, gdf-5 | X. laevis | Throughout NF stage 59 | hand joint region forelimb cartilage tissue |
Image source: Published
Permanent Image Page
Printer Friendly View
XB-IMG-132714