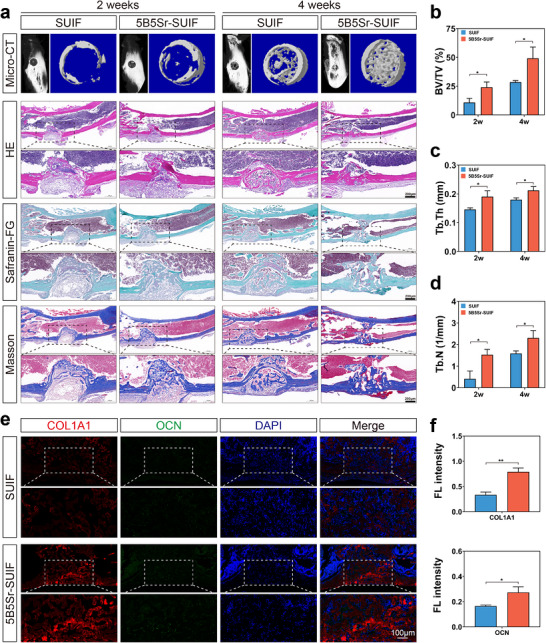
FIGURE 6. In vivo osteogenic performance of SUIF. (a) Representative micro‐CT reconstructions and histological images (HE, Safranin O‐Fast Green, and Masson's trichrome staining) of mouse tibial defects 2 and 4 weeks after implantation of the materials. micro‐CT‐based quantitative analysis of bone volume fraction (BV/TV) (b), trabecular thickness (Tb.Th) (c), and trabecular number (Tb.N) (d). (e) Immuno‐fluorescence staining of osteogenesis‐related markers COL1A1 and OCN in the regenerated bone tissue.
Image published in: Lu Y et al. (2026)
Image downloaded from an Open Access article in PubMed Central. © 2026 The Author(s). Endocrinology, Diabetes & Metabolism published by John Wiley & Sons Ltd.
Permanent Image Page
Printer Friendly View
ECB-IMG-208624