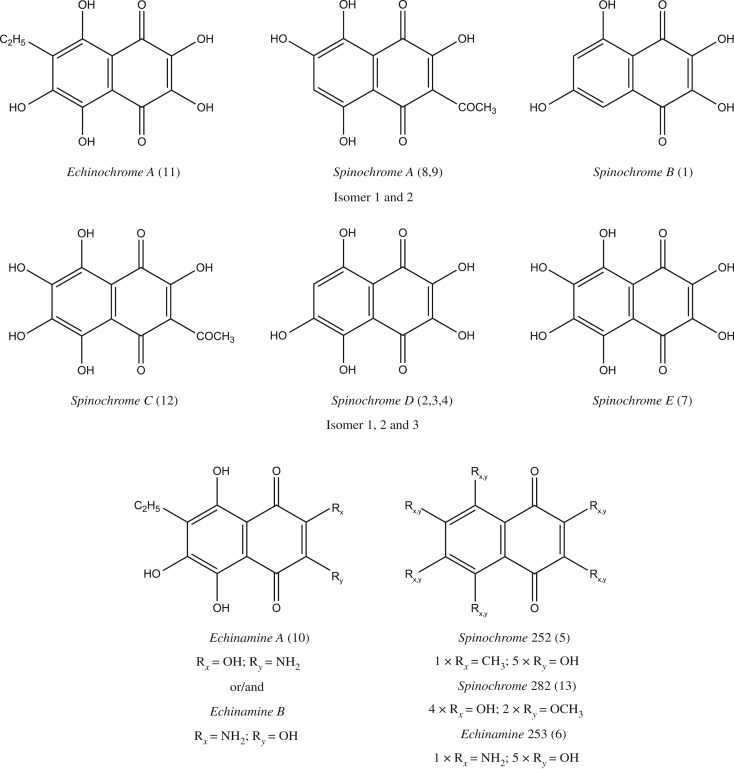
Figure 3. PHNQ molecular structures from E. mathaei. Isomers of the Spinochrome A and the Spinochrome D are not represented in this figure. The Echinamine A and B are both represented as we cannot make a clear-cut distinction. The potentially new PHNQ are represented with their hypothetical defined functional groups. The annotation is defined as the number of functional groups à Rposition on figure = functional group.
Image published in: Brasseur L et al. (2018)
Image downloaded from an Open Access article in PubMed Central. © 2018 The Authors. Published under the terms of the CC BY 4.0 license
Permanent Image Page
Printer Friendly View
ECB-IMG-185196