XB-IMG-1056
Xenbase Image ID: 1056
|
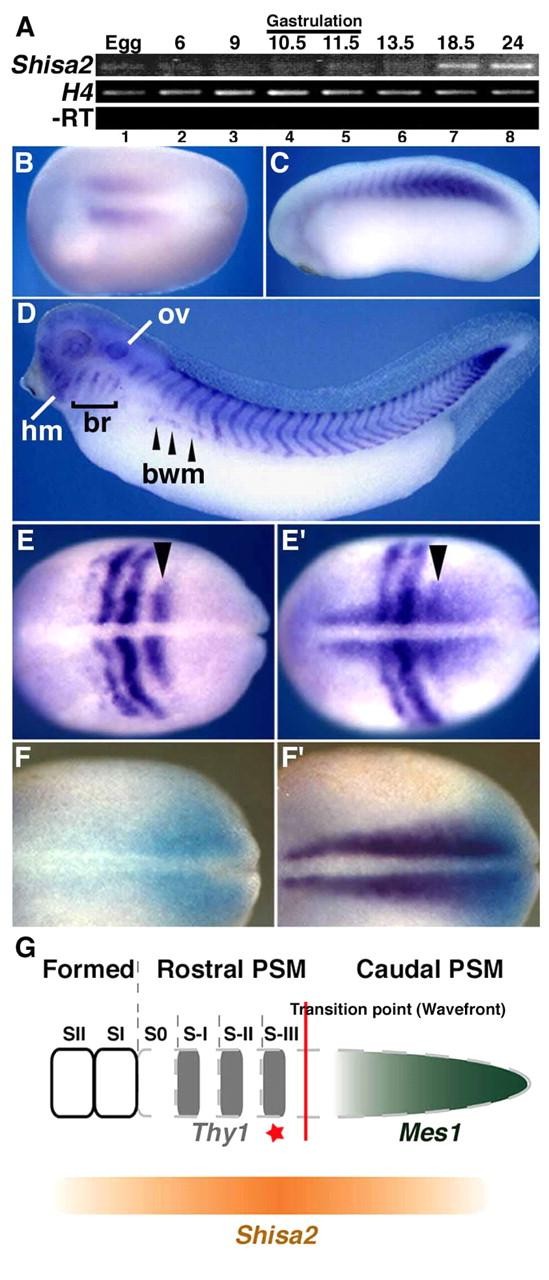
Fig. 3. Expression of Shisa2 in somitogenesis. (A) Temporal expressions of Shisa2 were analyzed by RT-PCR with RNAs isolated from stages indicated at the top. (B-Fâ ²) Whole-mount in situ hybridization of Shisa2. (B) Dorsal view of the early neurula stage embryo (stage 14). Anterior is to the left. (C) Lateral view of tailbud stage embryo (stage 26). (D) Lateral view of tadpole (stage 33). (E-Fâ ²) Whole-mount in situ hybridization of stage 15 embryos (dorsal view, anterior towards the left). Thy1 probe alone (E) or together with Shisa2 probe (E'). Shisa2 expression covers S-III/Thy1 stripes (arrowheads in E and E'). Mes1 probe alone (F, light blue) or together with Shisa2 (F', purple). Shisa2 expression overlaps that of Mes1. (G) Schematic diagram showing the geometric relationship between the transition point and expression of Thy1, Mes1 and Shisa2. The most caudal Thy1 stripe marks the most newly fate-determined somitomere (S-III, red asterisk), which has just passed through the transition point (wavefront). bm, body wall muscle; hm, head mesenchyme; ov, otic vesicle. Image published in: Nagano T et al. (2006) Copyright © 2006. Image reproduced with permission of the Publisher and the copyright holder. This is an Open Access article distributed under the terms of the Creative Commons Attribution License.
Image source: Published Larger Image Printer Friendly View |